- Date 15th June; IPO Open 16-20th June at Rs. 600-603
- Valuations: P/E 34.3 times TTM, P/B 15.4 times
- Mid Cap: Rs. 8,300 crore Mkt cap
- Industry – Pharma sector
- Advice: Investors can BUY with a 2 year perspective
Overview: Eris is an Ahmedabad based firm that develops, manufactures and sells branded pharma products from the chronic and acute categories in the Indian pharma market. Revenues for FY17 were Rs. 725 cr. and profit Rs. 242 cr. ERIS’s revenues, EBITDA and PAT grew at 16.6%, 34.7% and 42.8% CAGR in 5 years. Within the growing industry, Eris has a market share of 0.7% achieved in just 10 years of existence. There is certainly ample scope for Eris to grow both market share and absolute revenues. Eris is already growing fast and stands out for the domestic focus, strong marketing & sales, good business relationships with doctors (B2D) and efficient mfg. & procurement giving high margins. At a P/E of 34.25 TTM the valuations in the IPO are high but not aggressive, and justified by Eris’ growth rates.
Key risks: 1) Pending complaints with the Medical Council of India 2) Adherence to voluntary code of UCPMP 3) We are unsure that Eris will be able to maintain its high growth rates, high procurement of products and subsequently margins
Opinion: This IPO offering is rated BUY, and investors can invest with a 2 year perspective.
Here is a note on Eris Lifesciences Ltd. (Eris) IPO.
IPO highlights
- The IPO opens: 16-20th June 2017 with the Price band: Rs. 600-603 per share.
- Shares offered to public number 2.87 cr. The FV of each is Rs. 1 and market Lot is 24.
- The IPO in total will collect Rs 1,741 cr. while selling 21% of equity. The offer is a complete OFS and the selling shareholders will receive the entire sum. ChrysCapital’s investment arm Botticelli would be exiting by selling its current 16.3% stake. Botticelli’s average cost of acquisition in Eris was Rs 87.27/share giving them 6.9x on their investment in 6 years. The other selling shareholders are individuals who hold around 4-9% stake individually in the company. The promoter & promoter group owns 59.18% in ERIS which will fall to 55.9% post-IPO.
- The IPO share quotas for QIB, NIB and retail are in ratio of 75:15:10.
- The unofficial/ grey market premium for this IPO is Rs. 86/share. This is a positive.
Introduction
- Eris is an Ahmedabad based firm that develops, manufactures and sells branded pharma products from the chronic and acute categories in the Indian pharma market.
- Revenues and profit for FY17 were Rs. 725 cr. and Rs. 242 cr. It has 2,645 full time employees out of which over half – 1,501 are sales reps.
- So Eris has strong sales, marketing and distribution capabilities with 7 sales divisions focused on developing and growing engagement with doctors.
- Eris products are cardiovascular, anti-diabetics, vitamins, gastroenterology and anti-infectives from the chronic and acute category which are linked to lifestyle disorders. The chronic category contributed 65.6% of its revenues in FY17. The product portfolio has 80 mother brand groups (FY17) and is focused on therapeutic areas which are handled by specialists and super specialists such as cardiologists, diabetologists, endocrinologists and gastroenterologists. See Exhibit 1.
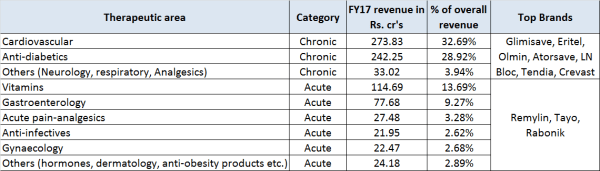
Exhibit 1 – Eris products, therapeutic areas, revenues and brands, Source RHP
- Between FY13 and FY17, there has been an increase in the no. of doctors prescribing their products from 37,842 (about 13.8% of doctors in metros and class 1 towns in India) to 50,282 (15.7% of doctors in metro and class 1 towns) with a prescription share of 1.3% for FY17.
- Eris owns and operates a mfg. facility in Guwahati, Assam. They also outsource the mfg. of some products, and currently have 20 third party mfg. vendors.
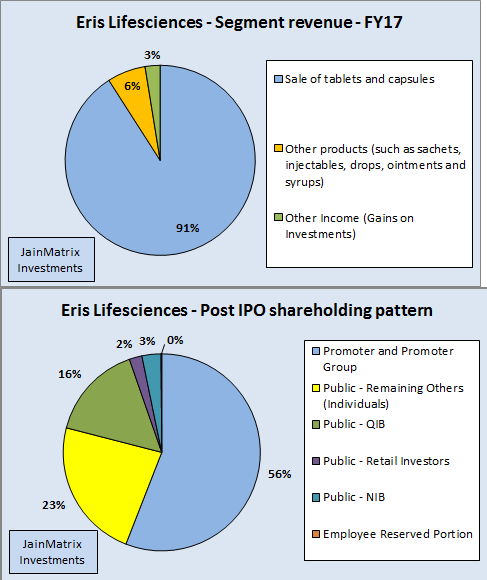
Fig 2 – ERIS Segment revenue and Fig 3 Post IPO Shareholding Pattern
- Eris has 3 subsidiaries namely Eris Therapeutics Pvt. Ltd (wholly owned), Aprica Health (wholly owned) and Kinedex. As of June 2017, Eris and subsidiaries have registered 138 trademarks for various brand names. It has a team of 32 personnel working in its IP and R&D department.
- In July 2016, Eris acquired trademarks in relation to 40 brands, from Amay Pharma for Rs.32.8 cr., in order to grow their product portfolio in the cardiovascular and anti-diabetics therapeutic areas. Amay Pharma’s revenues, from these brands were Rs. 19.3 cr.
- In Nov 2016, ERIS acquired 75.48% share of Kinedex for Rs. 77.2 cr.
- It focuses on products for mobility related disorders in the musculoskeletal therapeutic area, within the acute pain-analgesics therapeutic area. Kinedex’s revenues were Rs. 83 cr. for FY17.
- Eris’s facility in Guwahati had a capacity utilization for tablets, capsules and sachets of 76%, 57.6% and 19.6% resp. It enjoys tax break under Income Tax Act, which will continue post GST till FY24.
- For FY16 and FY17, the products made at Guwahati contributed to 51.6% and 59.3% of their revenues. An additional 28.2% and 18.7% of revenues for the same periods was mfg. in partnership with Sozin Flora Pharma. Eris was a partner in Sozin up to Aug 2016, and then transferred their stake to the other partners of Sozin, to enhance operational efficiency and productivity.
- Leadership is Amit Bakshi (CMD), Kaushal Shah (Head mfg. & dist.) Sachin Shah (CFO), Rajendra Patel (Head procurement)
News, Updates and Strategies of ERIS
- Eris with Indian Medical Association and Heart Care Foundation of India conducted a national study for ambulatory blood pressure readings amongst medical fraternity in May 2017. It was found that 50% physicians were suffering from hypertension despite taking hypertensive medicines; 56% from irregular BP at night and 21% from masked hypertension.
- Eris will consolidate its position in therapeutic areas in which they have good presence including:
- Targeting new categories within its existing therapeutic areas, e.g. strengthening its position in the anti-diabetes therapeutic area by launching new products.
- Continuing to expand its network of key opinion leaders (KOL) in existing therapeutic areas and increase its coverage of specialists to drive growth in prescriptions.
- Continuing to execute on its doctor-patient engagement model by leveraging diagnostics and technology to aid better outcomes and enhance patient compliance.
- Eris will explore in-licensing and co-development opportunities with other pharma firms. It will also utilize its R&D efforts to target select products which are currently under patent protection in India.
Indian Pharma Market Outlook
- India is one of the largest pharma markets in the world. Between FY13-17, revenues grew at 11.8% CAGR to reach Rs. 1,14,326 lakh cr. The IPM is the 13th largest market globally in terms of value and 3rd largest in terms of volume.
- The IPM is expected to grow at a CAGR of 11.6% between CY16-21. The underlying growth is driven by: 1) Favorable demographics and macro-economic developments 2) Rising prevalence of chronic diseases and 3) Medical talent including specialists and super specialists 4) increasing insurance coverage and 5) the under-penetration of medical infrastructure and talent.
- The IPM can be classified into acute and chronic The acute category comprises therapies intended for diseases of short duration and recent onset, including anti-infectives, gastro intestinal medication, vitamins and gynecology. The chronic category caters to non-communicable diseases that are prolonged in duration like heart disease, diabetes, cancer and arthritis.
- Eris has a 0.7% market share in IPM. It was ranked 20th out of the 377 domestic and MNC firms in the chronic category, in terms of revenues, for FY17, compared to 26th in FY13.
- Market share by revenue in the chronic category increased from 0.9% in FY13 to 1.4% in FY17.
Financials of ERIS
- ERIS’s revenues, EBITDA and PAT grew at 16.6%, 34.7% and 42.8% CAGR in 5 years, see Fig 4.
- The EPS has risen sharply in 5 years. This is excellent.
- Eris has positive cash from operations and FCF all the last 5 years, Fig 5. This is a positive.

Fig 4 – ERIS Financials

Fig 5 – ERIS Cash Flow
- Eris has declared dividend an interim dividend for FY16 amounting to Rs. 83 cr. (62.2% of FY16 PAT). Apart from this, the company hasn’t declared any dividend in the last 5 years including FY17.
- Eris had a RoE of 44.8% in FY17 while the 3 year avg. RoE stood at 42.9% (FY15-FY17). The RoCE stands at 50.9%. These are high, healthy and consistent return ratios.
- EBITDA margins jumped from 29.3% (FY16) to 39.7% (FY17), whereas the PAT margin increased from 22.4% (FY16) to 33.4% (FY17), reflecting a massive positive change. Such high margins were on account of low input costs, low interest costs and low effective tax rate (tax benefit at mfg. facility).
- Eris has a reserves and surplus balance of Rs. 526 cr. which is Rs. 38.26/share.
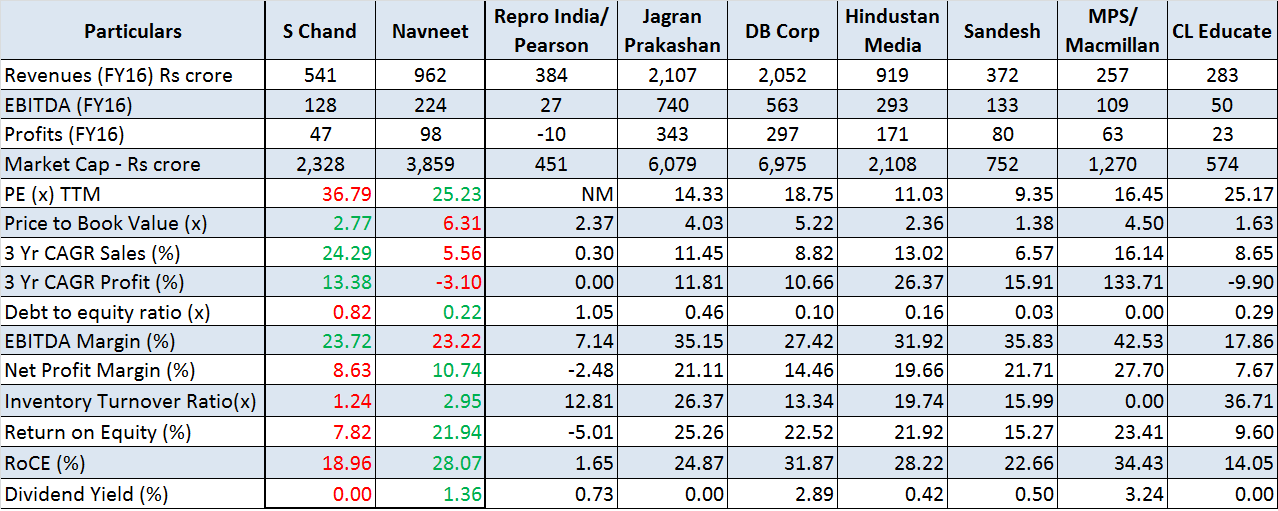
Benchmarking
We benchmark Eris against peers from pharma sector. See Exhibit 6.
- PE appears high at 34.25 compared to peers, but not a worry. The D/E ratio at 0.19 is comfortable.
- The P/B ratio is high at 15.36 times, but this is because just 52% of products are mfg. in-house, and the rest is procured. As long as vendor-partners can adhere to the quality norms, it’s good.

Exhibit 6 – Benchmarking
- Eris has witnessed fair sales but good profit growth recently. The 3 year PAT growth, EBITDA and PAT margins are high, coming in second highest of this group.
- The return ratios are excellent and highest in the group at 45-51% each. This is a positive, and allows Eris to command premium valuations as returns are on a small equity base of Rs. 13.75 cr.
- The company has not declared any dividend in FY17 unlike other pharma companies.
Positives for ERIS and the IPO
- Eris is a fast growing pharma company with a portfolio of complementary products. In the chronic category, they were the fastest growing, among the top 25 in terms of revenues.
- Eris has a portfolio of high volume and leading brands. Its focus is on metro cities and class 1 towns which have higher incidence of lifestyle disorders.
- Eris has strong sales, marketing and distribution capabilities and good engagement with doctors.
- The product range does not contain OTC products, so Eris has avoided the investment heavy consumer space. Instead it focuses on the B2D or Business to Doctor marketing. This we feel entails lower costs and helps maintain margins.
- The financial health of the company is good, and the company has grown rapidly under the leadership of Amit Bakshi. He was a pharma salesman who worked in companies like Torrent, Eli Lilly and Intas and had many years of experience in the pharma industry before starting Eris.
- Eris is immune to the global approvals/ USFDA risks as they have a domestic focused business.
- Leadership appears to be dynamic and aggressive, and using strategies that play to their strengths.
Risks and Negatives for ERIS and the IPO
- Eris has received letters from the Medical Council of India and certain state medical councils in connection with anonymous complaints, which allege that they have provided special benefits to several doctors. In the event the allegations are found to be true and in violation of applicable regulations and statutes, their reputation and business may be adversely affected.
- Stricter norms in India for companies doing business in the pharma industry could affect their ability to effectively market its products. The Dept. of Pharma announced details of the UCPMP, which became effective across India from Jan 1, 2015. The UCPMP is a voluntary code which, among other things, provides detailed guidelines about promotional materials, conduct of medical reps, physician samples, gifts and relationships with healthcare professionals. Although these guidelines are voluntary in nature, they may be made mandatory in the future.
- Will Eris be able to sustain the high growth rates and margins as it grows larger? While Eris still has a small market share in a growing market, typically pre IPO and small cap growth rates are difficult to sustain as a mid-cap firm. Competition too is intensifying in Eris’ key segments, and they will have to envision new strategies to continue on the growth path.
- By procuring 48% of products from vendors, Eris has kept investments low and got high margins. Will this strategy be suitable in future? Any quality control problems at their mfg. facility or those of their third party mfg. may damage their reputation and expose them to litigation or other liabilities.
- Some generic pharma sector risks: 1) If any of their products cause, or are perceived to cause, severe side effects, their reputation, revenues and profitability could be adversely affected. 2) The availability of counterfeit drugs, such as drugs passed off by others as their products, could adversely affect their brands.
Overall Opinion and Recommendation
- As India accelerates its per capita income from a low base, a lot of the individual income gains are directed to the pharma sector for better healthcare.
- Within the growing industry, Eris has a market share of 0.7% achieved in just 10 years of existence. There is certainly ample scope for Eris to grow both market share and absolute revenues.
- Eris is already growing fast and stands out for the domestic focus, strong marketing & sales, good connect with doctors & medical ecosystems, and efficient mfg. & procurement giving high margins.
- While the IPO is an exit opportunity for some investors, it empowers Eris for the next phase of growth by providing visibility and prestige, and the ability to raise fresh funds at low cost.
- At a P/E of 34.25 TTM the valuations in the IPO are high but not aggressive, and justified by Eris’ growth rates.
Opinion: This IPO offering is rated BUY, and investors can invest with a 2 year perspective.
JAINMATRIX KNOWLEDGE BASE
See other useful reports:
- JainMatrix Investments – Track Record
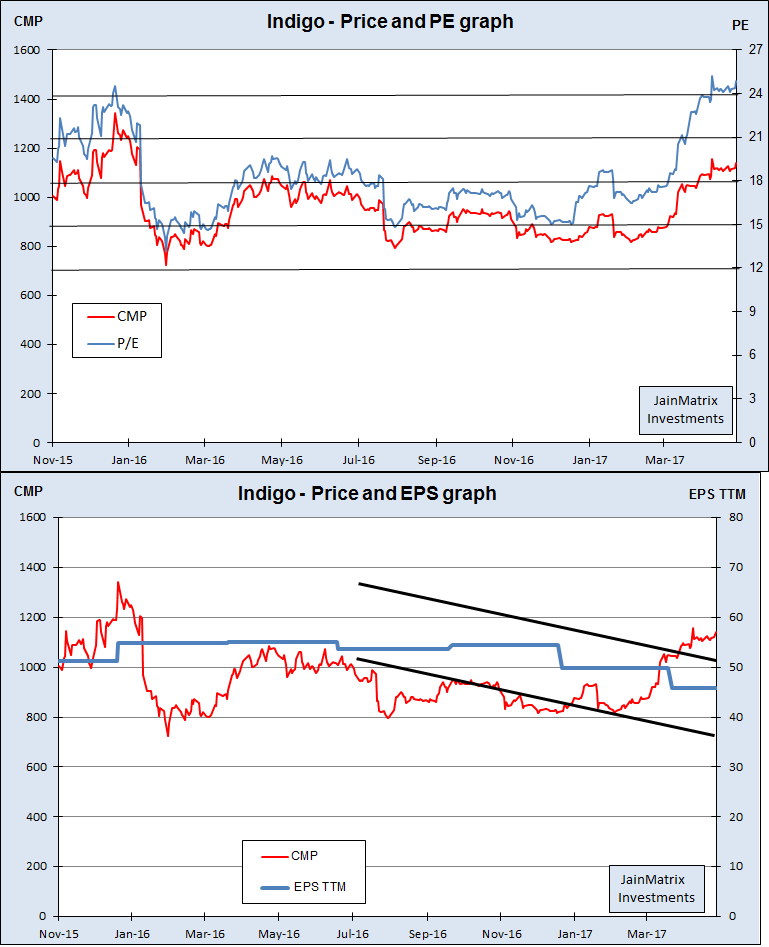
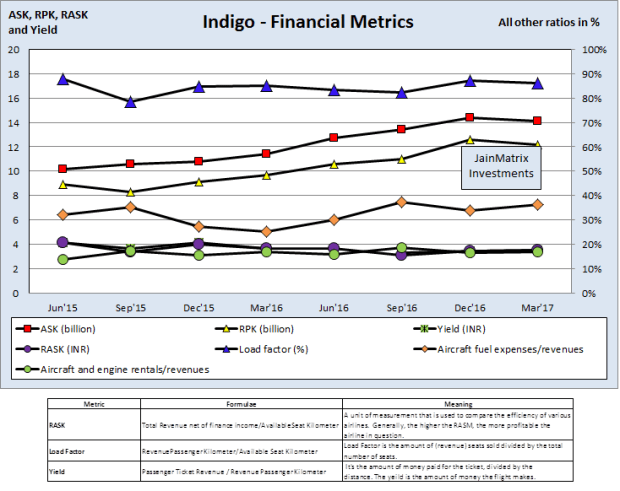
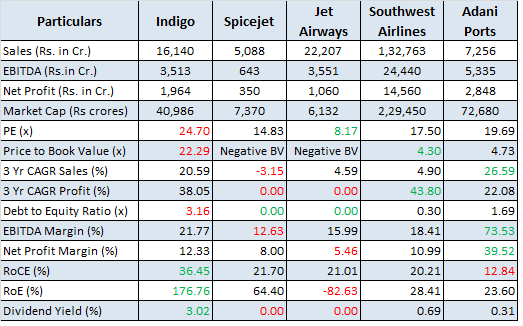
- IndiGo Airways – Flying High, Wide and Handsome
- Eicher Motors – It’s Firing on Both Engines
- Hudco IPO – Sector Uncertainties, AVOID
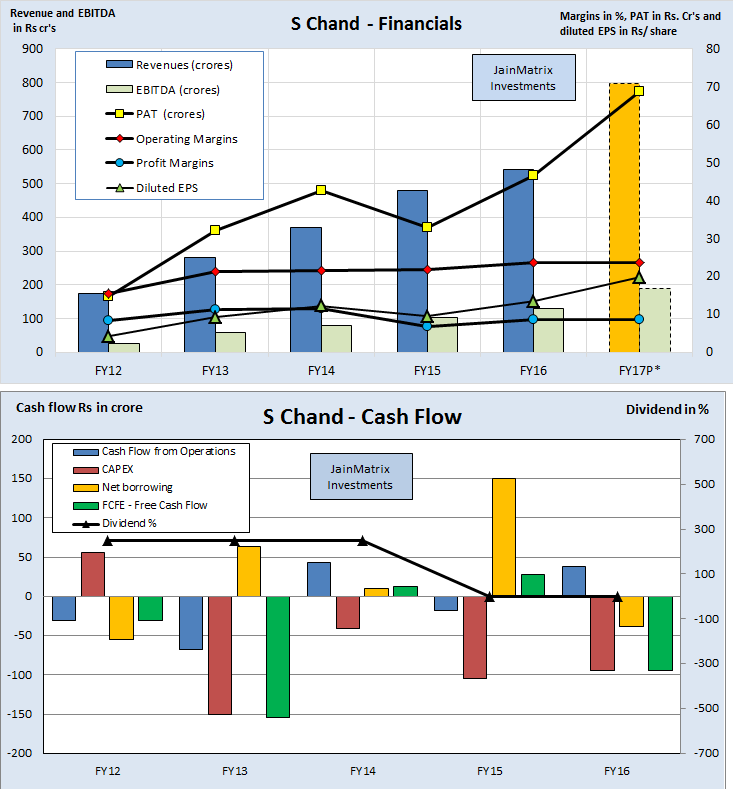
- S Chand IPO: An Educational Content Powerhouse
- Vikas Ecotech – Get ‘Vikas’ for your Investments
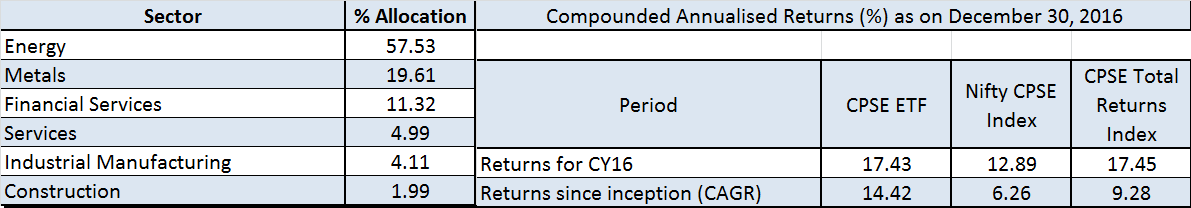
- CPSE ETF FFO 2 – An Energizing Offer – BUY
- Investment Notes – Euphoria
- Avenue Supermarts IPO: The Mart of Choice
- Bharat Electronics OFS
- Whats different about the Investment Service from JainMatrix? – A video
- Why are Indian stock markets attractive for Investments? – A video
- BSE IPO: Put this Exchange on Hold – Report plus Video
- Balmer Lawrie – An Update
- Why Stocks, and Investment Outlook – Dec 2016 – A Video
- Investment Outlook – Short Term Pain, Medium Term Gain
- PNB Housing Finance IPO: A Transformed Lender
- RBL Bank IPO
- Do you want to be a value investor?
- Mahanagar Gas IPO
- Announcement – SEBI approval as a Research Analyst
DO YOU FIND THIS SITE USEFUL?
- Visit the Investment Service page to find how you can get more. Or Click LINK
- Register Now to get our Free reports and much more, on the top right of this page, or by filling this Signup Form CLICK.
DISCLAIMER
This document has been prepared by JainMatrix Investments Bangalore (JM), and is meant for use by the recipient only as information and is not for circulation. This document is not to be reported or copied or made available to others without prior permission of JM. It should not be considered or taken as an offer to sell or a solicitation to buy or sell any security. The information contained in this report has been obtained from sources that are considered to be reliable. However, JM has not independently verified the accuracy or completeness of the same. JM has no stake ownership or known financial interests in Eris Lifesciences or any group company. Punit Jain may choose to apply for this IPO in the Retail category. Neither JM nor any of its affiliates, its directors or its employees accepts any responsibility of whatsoever nature for the information, statements and opinion given, made available or expressed herein or for any omission therein. Recipients of this report should be aware that past performance is not necessarily a guide to future performance and value of investments can go down as well. The suitability or otherwise of any investments will depend upon the recipient’s particular circumstances and, in case of doubt, advice should be sought from an Investment Adviser. Punit Jain is a registered Research Analyst under SEBI (Research Analysts) Regulations, 2014. JM has been publishing equity research reports since Nov 2012. Any questions should be directed to the director of JainMatrix Investments at punit.jain@jainmatrix.com.
Click and Share this post :