
10th Apr 2023
Lets evaluate several publicly available asset classes and try to answer this question. In addition, we will have a face off among two of the largest asset classes – Real Estate and Equity. This will help investors to build clarity and help choose among these assets.
Wealth Options and Components
In this Wealth chart Fig 1, we can see various Wealth Options and Components publicly available to investors.
- The old classic asset is Real Estate (RE), in the form of apartments, land, commercial property, etc.
- Equity markets are a rising star asset class as the digitization processes have made it transparent and accessible. Equity subcategories are also listed. AIF funds and PMS services are also available now.
- Debt, Jewellery (and Gold and precious metals) and Alternative assets are also available.
- Insurance is a wealth protection asset, helping cover some risks.
- Loans are a part of your wealth, however they can be taken for Appreciating or Depreciating Assets (AA/DA). Loans are better used to buy an AA like house or education, than for DAs like furniture, cars and holidays.
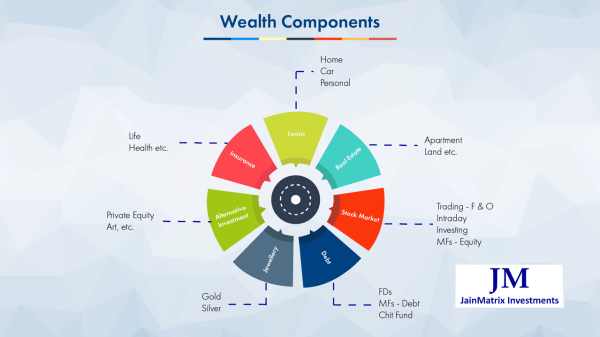
Fig 1 Wealth Options
Choosing among the Asset Classes
Here is a chart of Average Returns versus Risk for each of these assets, Fig 2.
- Returns for each asset class vary by subclass and by time periods. Here we try to take the multi-year average for each class over 5-6 years period of time.
- Equity ETFs and MFs returns are simplified as the Nifty index.
- Direct equity assumes blended returns across market caps.

Fig 2 Wealth and Risk
Hence the broad principle is – You need to take a higher risk to get a higher return.
- There are perhaps higher risk asset classes such as F&O and Private equity. Several Wealth Options are not seen here. Its seen that results and returns vary widely among Classes and so results cannot be generalized.
- All asset classes are probabilistic in terms of returns and risks. This means that while the average returns for RE (for example) may be 8-10% per year, there can be a particular year where this may be 15-20% on the high side and (-10%) on the low side.
The choice among these assets depends upon risk appetite, comfort level and nature of the investor.
- However the chart points to Equity as a higher returns asset, if we are able to manage the higher risk.
- Having seen all this, the suggestion to the new investor is to try some of these asset options in small quantities to get a better understanding. Here RE is difficult as it is a big ticket item, but the others can be bought for small sums.
- A Bank savings account and a Stock broking account would be required to try out these (non RE) assets.
Real Estate versus Equity
In this section we delve deeper into the two most common asset classes – Real Estate and Equity.
Assumptions
Let’s simplify Real Estate to an apartment purchase in the person’s place of work. For own use, and as an upgrade from paying rent. Other Real Estate options such as a second house for investing or a plot for investment or commercial property are not being considered here.
Also Equity will also be simplified as Nifty index investments. Specific products such as MFs, PMS, and Direct Equity investment services such as that offered by JainMatrix Investments will not be considered here.
Comparison
In the following table we compare the Real Estate and Equity asset classes across key parameters. (Table 3)
| Criteria | Real Estate – Apartment | Equity – Nifty |
| Ticket size | Ranges from ₹ 25 lakhs to crores depending on city and location. However if you buy with a loan, you need to pay 20% as down payment. | Generally speaking the Nifty ETF products start with ₹ 5000, and go to any number. Direct equity has no minimum. |
| Source for buying and selling | New apartments can be bought directly from builders. Second sale or older are from known people or with the help of real estate brokers. Aggregator websites also help with real estate information and brokers. | Buying Platform – You will need a Stock Broking account for direct equity purchase. Products like MFs and ETFs can also be bought from Bank account – investment channels. And also directly from Fund website or MF distributors. |
| Rating for Identifying and buying | This can be HARD and complex. Here the buyer has to identify the location, size of property, new v/s old, builder, etc. The process involves visiting potential properties, finalizing criteria, rating them, and closing the purchase, followed by registering the property. | If you decide to invest in the Nifty, it’s EASY and a simple choice of Nifty ETFs. Otherwise the rating is MEDIUM. There are 5000+ listed firms in India, but homing in to a purchase decision of 5-10-20 shares needs reading, and decisions. JainMatrix Investments provides this advisory service. Similarly choosing among MFs or PMSs. |
| Time and costs for Transactions | This can take anything from 2 months to a year. The cost over and above property cost may be Stamp Duty and Registration Tax for new properties, but may also include brokerage depending upon the agent or services used. | With digitalization, time to buy is very less, 1-2 days, once the buying platform is in place. Brokerage costs vary from 0.75% of purchase for full service brokers to very low for discount brokers. Other taxes are less than 0.1% except Capital Gains tax. |
| Selling; and Time and cost | Selling is also HARD. From a decision to sell, to actual transaction it can take from 2-6 months. Brokers, websites or personal network can help. The cost can be 1-2% of property value. There are payment risks so one has to be disciplined in the process. | Selling is EASY. The transaction happens at market rates, and funds are transferred in 1-2 days. Brokerage and other costs are similar as buying. |
| Total cycle time | So one can see that the total cycle time for Real Estate is long. It includes Buying time, holding period and selling time. | Varies by approach. The Nifty ETF or other equity assets can be held till the cash is required or a better investment has been found. At JainMatrix, we suggest Long Term Investments in quality companies, which allow the money to compound. However periodic pruning of a Direct Equity portfolio can be done every 6 months, to let the winners ride and exit underperformers. |
| Utility | An apartment in use by the owner is useful, saves rent and provides pride of ownership. | Equity investments appreciate and earn dividend. We must save for a rainy day!! |
| Capital Gains | Long Term Capital Gains kick in at a holding of over 2 years. Typically from buy to sell may be 8-12 years on average. | Long Term Capital Gains holding period is over 1 year. |
| Returns from Investing | A house to stay is a good choice in terms of stability and rootedness rather than just monetary returns. It saves on rent. Having said that, an apartment asset can give 8-10% returns on average. Fig 2. | The Nifty has given 12-14% CAGR returns over the past decade. Returns are estimated higher for Direct Equity. See Fig 2. |
Real Estate versus Equity Opinion by JainMatrix
In fact both Real Estate and Equities are asset classes that can complement each other. Investments should be started early in the working life, salaried or business. These can be in Equity, as the minimum is a small ticket size. In a few years as this asset grows, and the need arises, it can help to initiate a real estate purchase.
Finally Pros and Cons of Equity
Pros
- High average returns. Rising asset class.
- Indian equity markets have achieved a global size, volumes and transparency.
- Flexible – minimum ticket size is small, but it can scale for larger investments.
- Fast yet robust – digital enablement now allows a stock broking account to be as easy and convenient to handle as a savings bank account. Buying, selling and dividend transactions also happen digitally. Websites and mobile applications have also improved access and ease of navigation.
- Tax friendly – the tax rules are encouraging for equity with just 1 year for Long Term Capital Gains, LTCG not being taxed until it crosses a certain sum, and ability to set off losses one year with gains in another year.
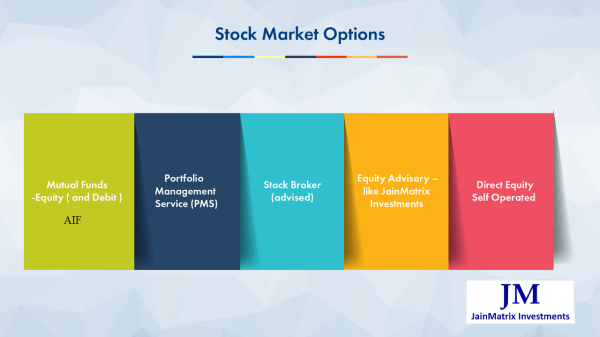
- Several equity products like Direct Equity access, MFs, PMS, small case and advisory services allow flexible access to all kinds of investors. See Fig 4.
Cons
- Equity investors are exposed to market risks, and also industry and company specific risks like fraud, global events, war, weather, currency, etc.
- Fear and Greed are driving forces in equity markets, and equities can alternate between expensive (excessively high valuations) and cheap (too low valuations).
- Patience is a virtue, and expecting quick returns can be detrimental for investors.
- Short term Trading versus Long Term Investing is also a difficult choice for those new to equity markets.
Conclusion
Equity penetration in India is low due to lack of access to stock brokers, pre existing fears of stock markets, inertia and invisible nature of equity assets. However a look at developed markets shows that penetration is as high as 50% compared to India’s 5-6%. Further, financialization of Indians’ assets has begun, with We expect steady growth of equity penetration and
Glossary
- AIF – Alternative Investment Funds are SEBI regulated and pools of funds from specific investors as per a previously defined investment policy. Next version of Mutual Funds
- PMS – Portfolio Management Service.
- MF – Mutual Fund
- ETF – Exchange Traded Fund – a type of MF which is passively managed, and usually shadows a well-known Index or commodity. It typically has lower management fees compared to actively managed MFs.
My Standard Disclaimer
Investment in securities market are subject to market risks. Read all the related documents carefully before investing. This document has been prepared by JainMatrix Investments Bangalore (JM), and is meant for use by the recipient only as information and is not for circulation. This document is not to be reported or copied or made available to others without prior permission of JM. It should not be considered or taken as an offer to sell or a solicitation to buy or sell any security. The information contained in this report has been obtained from sources that are considered to be reliable. However, JM has not independently verified the accuracy or completeness of the same. Neither JM nor any of its affiliates, its directors or its employees accepts any responsibility of whatsoever nature for the information, statements and opinion given, made available or expressed herein or for any omission therein. The suitability or otherwise of any investments will depend upon the recipient’s particular circumstances and, in case of doubt, advice should be sought from a RIA – Registered Investment Advisor.
Punit Jain is a registered Research Analyst under SEBI (Research Analysts) Regulations, 2014. JM has been publishing equity research reports since Nov 2012. Any questions should be directed to the director of JainMatrix Investments at punit.jain@jainmatrix.com

Leave a comment