
Category: IPO/FPO ANALYSIS
-
Laser Power IPO: A Good Conductor: Video
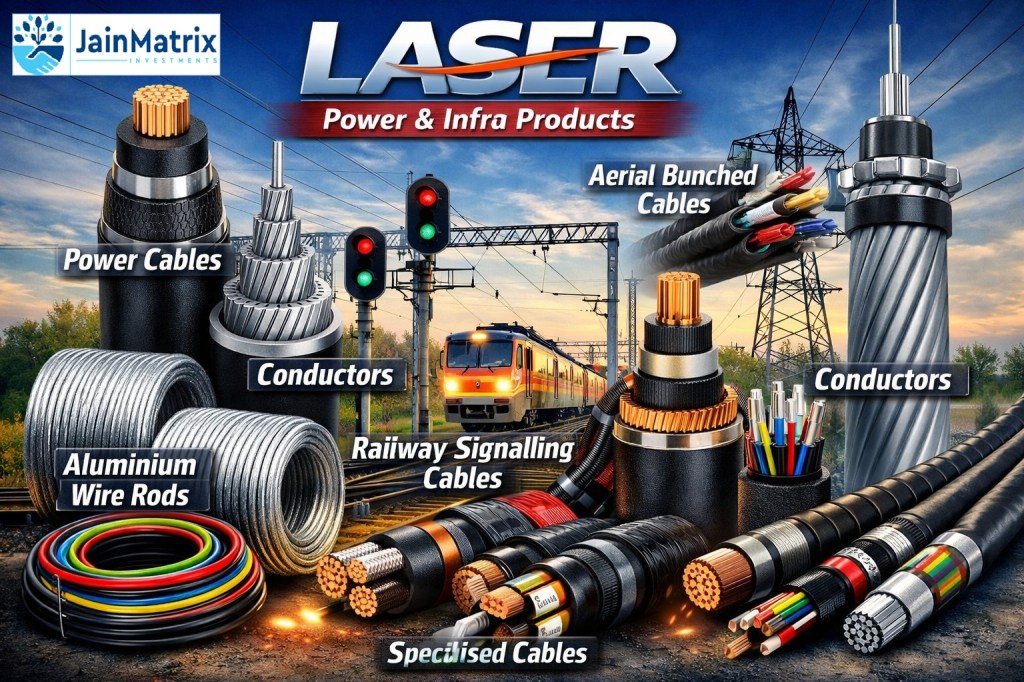
We share a short video of this IPO. Summary IPO highlights Introduction to Laser Fig 1a – Products of Laser Download the PDF report here – Disclaimers and Disclosures Punit Jain discloses that he has no shareholding in Laser, or any group company. In addition, JainMatrix Investments Bangalore (JMI) and its promoters/ employees also have…
-
Laser Power IPO: A Good Conductor
See Update with Video on Laser Power IPO Summary IPO highlights Introduction to Laser Fig 1a – Products of Laser Download the PDF report here – Disclaimers and Disclosures Punit Jain discloses that he has no shareholding in Laser, or any group company. In addition, JainMatrix Investments Bangalore (JMI) and its promoters/ employees also have…
-
-
SIF – An Exciting Product Innovation from MFs
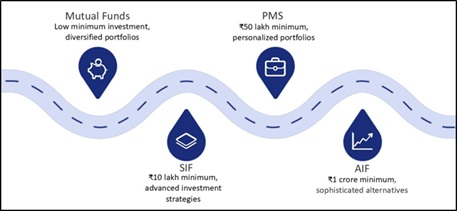
Summary: Specialised Investment Funds (SIF) are a new SEBI introduced investment category that bridges Mutual Funds and PMS/AIF. They offer advanced investment strategies, smaller minimum investment, greater flexibility, and a regulated structure, making SIF an interesting new investment product. Here is a deep dive into this new category. Introduction to SIFs Specialized Investment Funds (SIFs)…
-
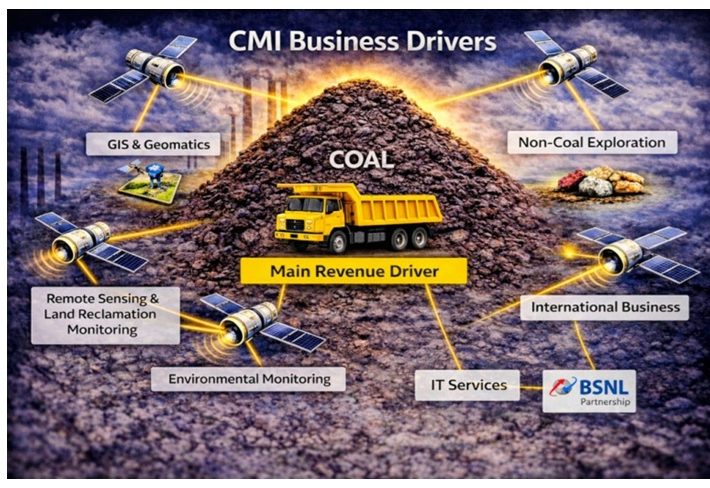
CMI IPO – Self Sufficiency in Fuels – Buy
IPO highlights Introduction News, Updates and Strategies Industry Overview Market Trends: Financial Performance and Stock Evaluation Overall, CMI’s financials reflects strong profitability, efficient capital utilization, and stable operations. SWOT Analysis Benchmarking CMI is compared with peers in engineering, consultancy, project & analytical services. See Fig 4b. Opinion, Outlook and Recommendation Disclaimers and Disclosures
-
Tata Capital IPO – Emerging Player
In this note, we look closely at Tata Capital Ltd (TCL) which is opening for its IPO this week. IPO Details Tata Capital Introduction Comparison of Financial Parameters We analyse the key ratios and financial data for TCL with 2 peers. See table and analyses below. Fig 1 Benchmarking Annual data is for…
-
Belrise Industries IPO – Strong as the Chassis
IPO highlights Summary Entire Report in PDF format: Disclaimers and Disclosures
