
- Date 9th Oct
- IPO Opens 6-10th Oct at Rs. 456-459
- Valuations: P/E 36.6 times TTM, P/B 4.4 times (Post IPO)
- Small Cap: Rs. 2,500 cr. Mkt cap
- Industry – NBFC
- Advice: SUBSCRIBE with a 2 year perspective
Summary
- Overview: MAS is a Gujarat-headquartered NBFC with the business products focused on middle and low income customer segments. Revenues and profit for FY17 were Rs. 365 cr. and Rs. 69 cr. The revenues, NII and PAT grew at 26.3%, 22.8% and 25.8% CAGR in 5 years.
- At a P/B of 4.44 times (adjusted post IPO), the valuations of the IPO are on the upper side. However strong financials, good asset quality, experienced management and operations in high growth business segments make this issue attractive.
- Risks: 1) Regional concentration: As of FY17 60% of the AUM was in the state of Gujarat 2) Small size of the firm exposes business to seasonal and employee exit risks.
- Opinion: Investors can SUBSCRIBE to this IPO with a 2 year perspective.
Here is a note on MAS Financial Services (MAS) IPO.
IPO highlights
- The IPO opens: 6-10th Oct 2017 with the Price band: Rs. 456-459 per share.
- Shares offered to public are 0.98 cr. The FV of each is Rs. 10 and market Lot is 32. The IPO share quotas for QIB, NIB and retail are in ratio of 50:15:35.
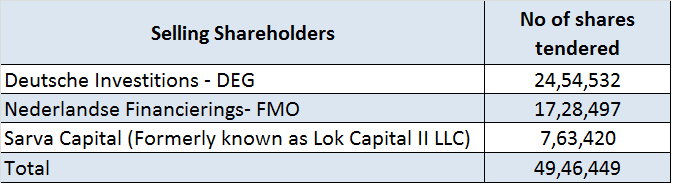
Exhibit 1 – IPO Selling Shareholders
- The IPO in total will collect Rs 460 cr. while selling 18.3% of equity. The IPO include an OFS for Rs. 227 cr. (at UMP) and an issue of fresh shares of Rs. 233 cr.
- The promoter group owns 80.6% in MAS which will fall to 73.1% post-IPO. Other selling share-holders are DEG, FMO and Sarva Capital. DEG and FMO are selling 100% of its stake, whereas Sarva Capital is selling 60% of its current stake in the company.
- The unofficial/ grey market premium for this IPO is Rs. 170-180/share. This is a positive.
- On day 2, the offering is subscribed 4.8 times, so it looks headed for a very successful listing.
Introduction
- MAS is a Gujarat based NBFC with business focused on middle and low income customer segments.
- Revenues and profit for FY17 were Rs. 365 cr. and Rs. 69 cr. It has 606 employees.
- It offers (i) micro-enterprise loans (ii) SME loans (iii) two-wheeler loans (iv) Commercial Vehicle loans (which include new and used CVs, used cars and tractor loans) and (v) housing loans.
- 59% of their gross AUM are micro enterprise loans (FY17). Also, 83.9% of their loans were secured.
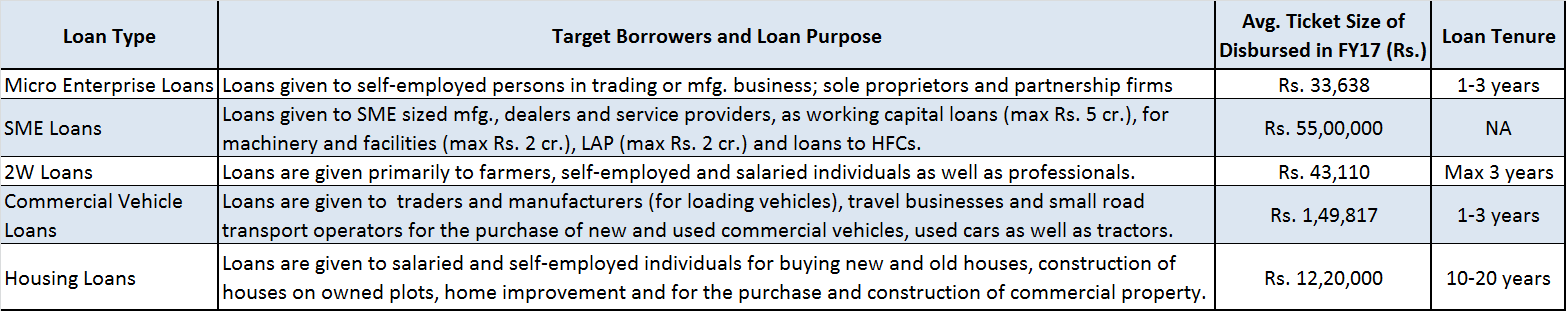
Exhibit 2 (a) – Loan products
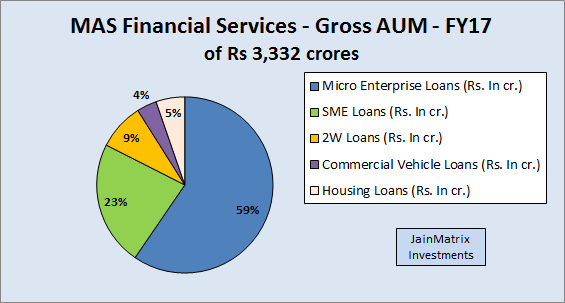
Exhibit 2 (b) AUM in FY17
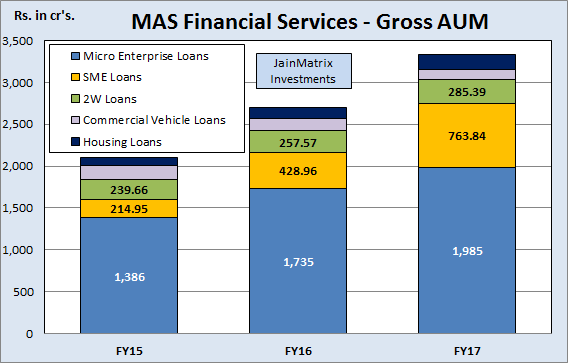
Exhibit 2 (c) – AUM growth
- MAS operated across 6 States and the NCT of Delhi through 121 branches.
- The gross AUM of MAS are displayed in Fig 2b and 2c. 60% and 20% of the AUM’s were from Guj. and Mah. in FY17. Hence there is a geographic concentration.
- Borrowings were Rs 1,506 cr. (Q1 FY18) and the average cost of borrowings was 9.47% (FY17), an increase from 8.41% in FY13. But in Q1 FY18 cost of borrowings stood at 9.05% indicating a fall.
- Leadership is Kamlesh Gandhi (CMD), Mukesh Gandhi (CFO) and Darshana Pandya (COO).
News, Updates and Strategies of MAS
- MAS’s business strategy is as follows:
- Strengthen marketing and sourcing channels while maintaining growth and quality of portfolio.
- Expand product offerings –extend loans to the agricultural input and equipment segment.
- Leverage existing network and customer base to develop their housing finance business.
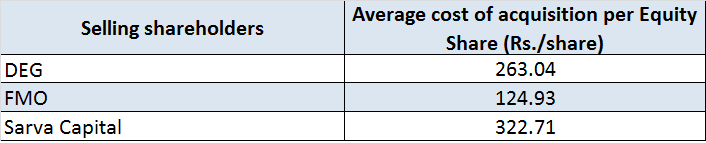
Exhibit 3 – Acquisition Cost for selling shareholders
- The average cost of acquisition of equity shares for selling shareholders is in Exhibit 3.
- Motilal Oswal Financial Services invested a total of Rs. 135 cr. ($20.8 mn.) in pre-IPO placement of MAS in March 2017 at Rs. 338/share. The IPO valuations are 36% higher than this.
- They have been in operation for more than two decades, and as of June 2017, they had 500,000 active loan accounts. The AUM has increased at 33.4% CAGR since FY13 and NNPAs have remained below 1% during this period. They have developed stringent credit quality checks and customized their operating procedures to regularly monitoring the loan portfolio.
- Mukesh Gandhi (CFO) is also the chairman of the Gujarat Finance Companies Association and a director of the Finance Industry Development Council.
NBFC Industry Outlook in India
- Financing needs in India have risen along with economic growth over the past decade. By complementing banks and other financial institutions, NBFCs help meet this need.
- NBFCs that cater to the masses in rural and semi-urban reaches, who have limited access to formal financing channels, and lend to the informal sector and people without credit histories, enable the govt. and regulators to realise the mission of financial inclusion.
- In the past, NBFCs gained market share at the expense of banks owing to focused lending, widening reach, and resource raising ability. However, going forward, the BFSI sector is on a revival path and competition will intensify given a slew of recent regulation changes.
- About 80-85% of NBFC lending is secured. In contrast, banks secure 60-70% of their lending portfolio. Security collateral is as plant and machinery, or current assets. To add to this, secondary collateral is collected in the form of immovable assets such as commercial and residential property and shares. Approval rates vary across NBFCs at between 70% and 75%.
- The loans of NBFCs grew at 20% between FY12-16. As of Mar 2016, they accounted for 15% of the overall credit. The loan book of NBFCs may post 17% CAGR between fiscals 2017-18.
- The contribution of the MSME sector to India’s GDP currently stands at 8% for 2011-12, and is growing at a rate higher than the projected GDP. MSME in India has the potential to increase the share of contribution to GDP from the current 8% to about 15% by the year 2020.
- MAS competes with Janalakshmi and Bharat Financial Inclusion in micro-finance, Shriram Finance and M&M Financial in auto finance; and Dewan Housing Finance and PNBHF in housing loans.
Financials of MAS
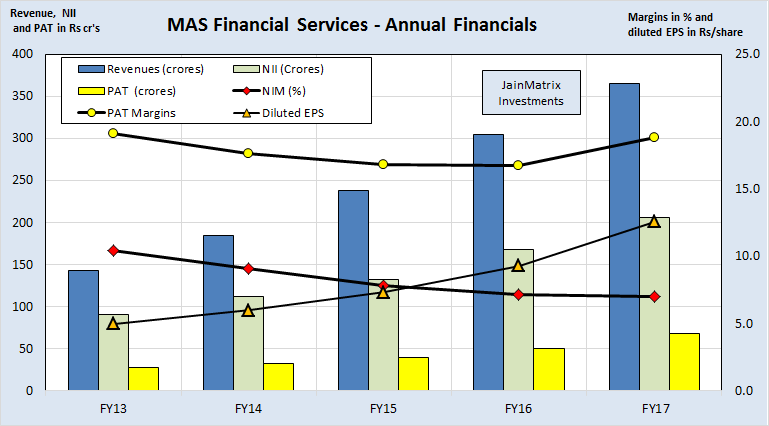
Fig 4 – Financials
- MAS’s revenues, NII and PAT grew at 26.3%, 22.8% and 25.8% CAGR in 5 years, see Fig 4.
- MAS had a RoE of 18.8% in FY17 while the FY15-17 avg. was 23.7%. The RoCE stands at 28.1%.
- In FY17, the disbursement growth was slow on account of demonetization.
- MAS declared a low dividend in FY17, as compared to prior years, to maintain prudent asset quality.
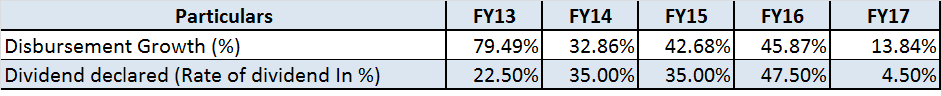
Exhibit 5 – Loan disbursement growth and dividends declared
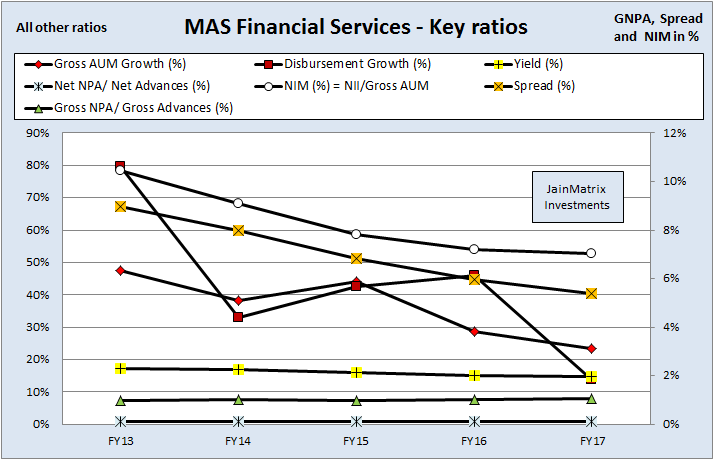
Fig 6 – Financial Metrics
- From Fig 6, we can see that the NIM’s, yield and spread have fallen from FY13-FY17. This is due to increased costs of borrowings and higher competition. However it is not a concern as the management has been able to maintain their asset quality combined with high growth numbers.
- The NIM’s have fallen steadily from 10.4% in FY13 to 7% in FY17. Also the cost of borrowings has risen during this period. This is a sign of increasing competition.
- The AUM growth and disbursement growth slowed in FY17 due to demonetization related issues.
- MAS’s asset quality has been robust over the last 5 years at NNPA’s lower than 1%. This is excellent as asset quality is crucial. The asset quality was maintained in spite of change in the classification of NPA for NBFC’s as per RBI NPA norms for overdue payments.
Benchmarking
We benchmark MAS against other NBFC’s from the same sector. See Exhibit 7.
- PE appears moderate at 36.5 times (diluted post IPO) compared to peers. But the P/B ratio appears high at 4.44 times (diluted post IPO). Established NBFCs like Shriram, Capital First and M&M Financial are in the 2.5-3.5 range. The highest is Bajaj Finance at 11.21 times. Thus the P/B is between above average and lower than some of the most expensively traded NBFC’s.
- The D/E ratio at 2.87 (diluted post IPO) is in the lower range and hence gives MAS scope to aggressively lend. The CAR of MAS stood at 22.9% for FY17 as against RBI’s minimum of 15%, which indicates that it is adequately capitalized.
- The RoE is the high at 20.6%. ROCE is the highest at 28.04%. This is a positive.
- MAS has witnessed good sales and profit growth. The 3 year growth is high while not the best.
- Dividend yield is low.
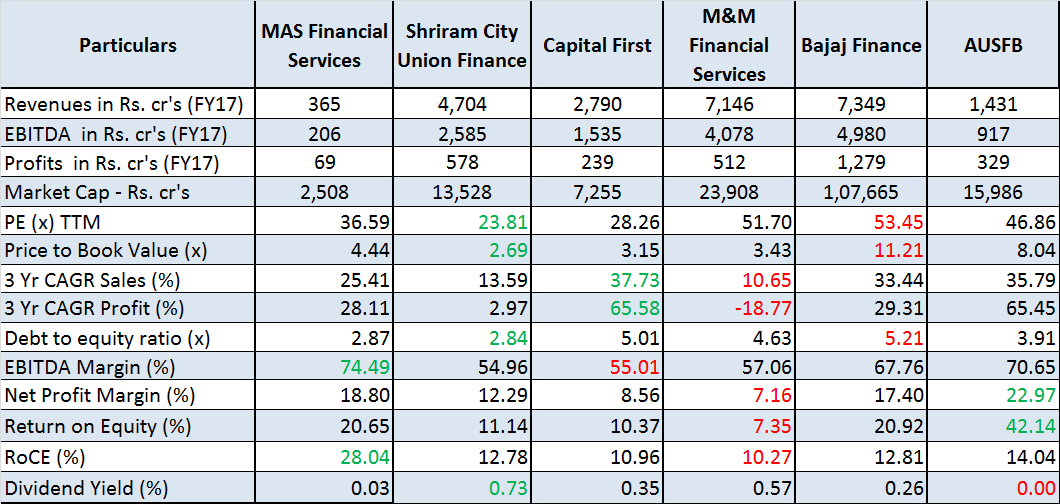
Exhibit 7 – Benchmarking
Positives for MAS and the IPO
- MAS has a track record of consistent growth with quality loan portfolio.
- The return ratios are high and amongst the best in the industry.
- MAS has deep market knowledge through sourcing channels. They have developed an extensive operational network in Gujarat and Mah. They entered into commercial arrangements with a number of sourcing intermediaries including commission based DSAs as well as sourcing partners where part of a loan default is guaranteed by the sourcing partner.
- MAS has an experienced management team. The promoters, Kamlesh Gandhi (CMD) and Mukesh Gandhi (CFO) have over 21 years of experience in financial services.
- The asset quality of MAS is stable with NNPAs at 0.92% for FY17. The financials of the company are also good. This is a positive for long term investors.
Risks and Negatives for MAS and the IPO
- As a very small player (revenues Rs 365 crores.) MAS may be affected by senior executive exits and seasonal fluctuations.
- The valuations are on the higher side in terms of P/B at 4.44 times (adjusted post IPO). Additionally as a small company MAS is still asking for rich valuations associated with mid to large companies with good reputations. This is an anomaly.
- Promoter shareholding is high at 73% post IPO. This can affect policies and decision making, and make MAS possibly prone to unilateral decisions not favoring small shareholders.
- MAS is facing an increasingly competitive industry, that may affect margins, income and market share. Consumers are being served by a range of financial entities, including, traditional banks, captive finance affiliates, NBFCs and SFB’s approved by RBI to enhance credit penetration.
- Geographic concentration: MAS’s business is primarily in Gujarat and Maharashtra. As of FY17, roughly 80% of AUM was located in such states, with Gujarat accounting for 60%.
Overall Opinion and Recommendation
- The BFSI sector has done well over the last few years (barring pockets like PSU Banks) with underpenetration in financial services, a fast growing economy and new emerging sectors and opportunities. In the private sector NBFC space, well managed firms have seen good growth.
- MAS has a good record in the regional markets of Guj. and Mah. There is ample scope for growth in these affluent regions.
- Strong financials, good asset quality, experienced management and operations in high growth business segments make this issue attractive.
- High geographical concentration of AUM and high valuations are key risks for MAS.
- At a P/B of 4.44 times (adjusted post IPO), the valuations of the IPO are on the upper side. However strong financials, good asset quality, experienced management and operations in high growth business segments make this issue attractive.
- Opinion: Investors can SUBSCRIBE to this IPO with a 2 year perspective.
Disclaimer
This document has been prepared by JainMatrix Investments Bangalore (JM), and is meant for use by the recipient only as information and is not for circulation. This document is not to be reported or copied or made available to others without prior permission of JM. It should not be considered or taken as an offer to sell or a solicitation to buy or sell any security. The information contained in this report has been obtained from sources that are considered to be reliable. However, JM has not independently verified the accuracy or completeness of the same. JM has no stake ownership or known financial interests in MAS or any group company. Punit Jain intends to apply for this IPO in the Retail category. Neither JM nor any of its affiliates, its directors or its employees accepts any responsibility of whatsoever nature for the information, statements and opinion given, made available or expressed herein or for any omission therein. Recipients of this report should be aware that past performance is not necessarily a guide to future performance and value of investments can go down as well. The suitability or otherwise of any investments will depend upon the recipient’s particular circumstances and, in case of doubt, advice should be sought from an Investment Advisor. Punit Jain is a registered Research Analyst under SEBI (Research Analysts) Regulations, 2014. JM has been publishing equity research reports since Nov 2012. Any questions should be directed to the director of JainMatrix Investments at punit.jain@jainmatrix.com.
