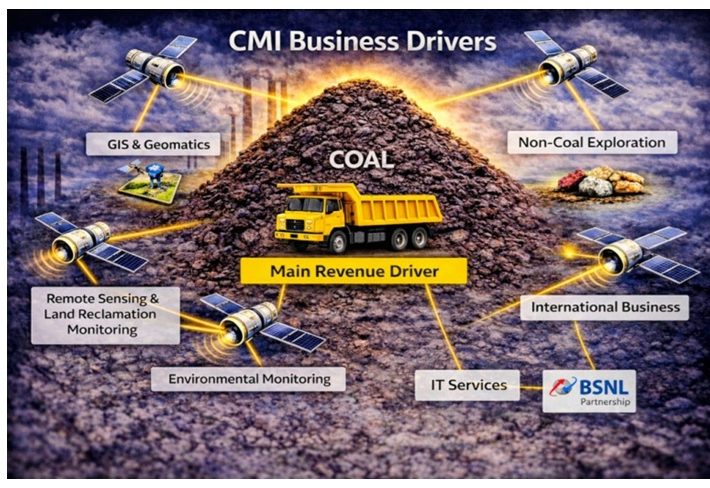
LIC IPO – Buy the Family Silver

JainMatrix Investments presents an Investment Report on RACL Geartech Ltd.

  • 03rd May 2022
  • Sector – Life Insurance
  • IPO Opens 4-9th May
  • Price range ₹902-949 /share; discount for policyholders is ₹60, and for employees is ₹45
  • Large Cap: ₹ 6,00,000 crore Mkt cap

Summary

  • Positives: 1) High life insurance market share 2) massive Assets Under Management and equity market ownership 3) LIC is a solid brand  4) low operating cost 5) good all India sales presence 6) the IPO can be transformative to make LIC more flexible, competitive and profitable.
  • Risks: 1) govt. initiatives and directives that are unprofitable 2) capital and profit ratio restructuring makes financials unpredictable 3) competition from private players and falling market share 4) High NPA ratio 5) attrition in sales agents team 6) Periodic FPOs can subdue the share price.
  • Opinion: Conservative Investors can SUBSCRIBE to this IPO with a 2 year perspective.

Other related IPO reports

Here is a note on LIC IPO.

IPO highlights

  • LIC IPO will have a price band of ₹ 902-949 and will open from May 2 for anchor investors and May 4-9 ‘22 for others.
  • The firm will raise ₹ 21,000 cr. by selling 3.5% stake sale through Offer for Sale (OFS) by promoter. LIC market cap at this pricing is ₹ 6 lakh cr.
  • Promoters of LIC are the President of India, acting through the Ministry of Finance, Government of India. Currently GoI holds 100% stake and post-IPO this will come down to 96.5%.
  • The IPO quotas are: Policy Holders 10%, employees 0.7%, QIB 44.6%, Non Institutional 13.4% and retail 31.25%. The total number of shares in IPO are 22.14 crore shares. This discount for policyholders is ₹60, and for employees is ₹45.
  • Objects of the issue: GoI unloads stake to list LIC. Since it is an OFS, it will not receive any funds in IPO
  • The grey market premium (GMP) of LIC is ₹85 as of today. 
  • One lot is 15 shares and Face Value is ₹10. Retail investors can bid for 1 to 14 lots i.e. 210 shares.
  • The anchor investor portion of Life Insurance Corporation of India’s (LIC) initial public offering (IPO) was oversubscribed on Monday, raising around ₹5,620 crore from anchor investors.

Introduction to LIC

  • LIC is the largest public life insurance companies in India, and took its current form in 1956.
  • It has a 64.1% market share in Gross Written Premium (GWP) in FY21 (CRISIL). It is the #5 largest life insurer globally by GWP, see Fig 1b. LIC has a distribution network of 5,004 offices spread across 36 states and UTs, with 28 cr. policies served as on FY22. It has a workforce of 1,05,207 employees.
  • The proposed IPO will make it the biggest Indian IPO ever.
  • In India, LIC has the largest agent network of 13.5 lakh individuals in 2021, which is 55% of the total agent network in the country and was 7.2 times the number of agents of the second largest life insurer.
  • LIC is the largest asset manager in India (Dec’21) with AUM (includes policyholders’ investment, shareholders’ investment and assets held to cover linked liabilities) of ₹ 41 lakh crores, which was (i) 3.2 times the AUM of all private life insurers in India, (ii) 15.6 times the AUM of the #2 player in Indian life insurance industry in terms of AUM, (iii) 1.1 times the entire Indian MF industry AUM and (iv) 17% of India’s GDP for FY22. (CRISIL). LIC’s investments in listed equity represented 4% of the total market capitalisation of NSE as at that date. (CRISIL). See Fig 1a. Close to 25% of this is equity oriented, and they own more government bonds than the RBI. Thus it is a mega player that can dominate and profit from the growing Indian capital markets. Thus it is India’s Family Silver, which is made available in the IPO.
  • LIC is thus both a Life Insurance and an Asset Management firm.

The rest of the report is available as a download, see PDF –

Do read our insightful research, we attach the complete Investment report in PDF format here.

Disclaimer

This document has been prepared by JainMatrix Investments Bangalore (JM), and is meant for use by the recipient only as information and is not for circulation. This document is not to be reported or copied or made available to others without prior permission of JM. It should not be considered or taken as an offer to sell or a solicitation to buy or sell any security. The information contained in this report has been obtained from sources that are considered to be reliable. However, JM has not independently verified the accuracy or completeness of the same. JM has no stake ownership or financial interests in LIC or any group company. Punit Jain has been a retail – insurance and annuity customer of LIC for 20+ years. Punit Jain intends to apply for this IPO. Neither JM nor any of its affiliates, its directors or its employees accepts any responsibility of whatsoever nature for the information, statements and opinion given, made available or expressed herein or for any omission therein. Recipients of this report should be aware that past performance is not necessarily a guide to future performance and value of investments can go down as well. The suitability or otherwise of any investments will depend upon the recipient’s particular circumstances and, in case of doubt, advice should be sought from a RIA – Registered Investment Advisor. Punit Jain is a registered Research Analyst under SEBI (Research Analysts) Regulations, 2014. JM has been publishing equity research reports since Nov 2012. Any questions should be directed to the director of JainMatrix Investments at punit.jain@jainmatrix.com.

Advertisement

RVNL IPO – Railways’ Growth Engine

  • Industry – Railway Transportation PSU in PMC space
  • Mid Cap of Rs. 4,000 crore
  • IPO Opens 29th Mar – 03rd Apr 2019; Price range Rs. 17-19/share
  • Valuations: P/E 6.9 times TTM; with a discount for Retail investors
  • Advice: SUBSCRIBE for listing gains

Summary

  • Transportation Infrastructure is a crying need in India. With Airlines, Roads and Ports sectors making good progress, the final frontier is the Indian Railways. The sleeping giant of IR appears to be getting up in the last few years.
  • IPO Overview: RVNL is a Delhi based PSU into PMC of Railway projects like track laying, electrification, bridges etc. Its FY18 revenue, EBITDA and PAT were Rs. 7,822 cr., Rs. 614 cr. and Rs. 570 cr. resp. Revenue has grown at an impressive 33.7% and PAT at 19.2% over the last 3 years. Valuations are attractively low with a FY18 PE of 6.9x for the IPO. It has an asset light model. A good kicker should come from Q4FY19 results and listing gains in a positive market. Governance appears good and transparent within the PSU limitations.
  • Key Risks: 1) Change in Central Govt. 2) De-emphasis on infra and railways by govt. 3) Issue of a contingent liability 4) Weak infra funding environment.
  • Opinion: Investors can SUBSCRIBE to this IPO with a listing gains and a 2 year perspective.

Here is a note on RVNL IPO.

IPO highlights

  • The IPO opens: 29th Mar-03rd Apr 2019 with the Price band: Rs. 17-19 per share. A discount of ₹0.50 per share on the offer price has been offered to retail and employee bidders.
  • Shares offered to public number 25.34 crore of FV Rs. 10 and each market lot is 780 shares.
  • The IPO will raise Rs. 482 cr. for 12% equity by current promoter i.e. Govt. of India with no dilution. The IPO share quotas for QIB, NIB and retail are in ratio of 50:15:35.
  • The unofficial/ grey market premium for this IPO is Rs. 1-1.5/share. This is a positive.

Introduction

  • RVNL – Rail Vikas Nigam Ltd – is a Delhi based PSU into PMC of Railway projects like track laying, electrification, bridges etc.
  • Its FY18 revenue, EBITDA and PAT were Rs. 7,822 cr., Rs. 614 cr. and Rs. 570 cr. resp. Revenue has grown at an impressive 33.7% and PAT at 19.2% over the last 3 years.
  • RVNL is a Miniratna (Category – I) firm incorporated by the Ministry of Railways (MoR) in 2003, as a project executing agency for MoR to undertake rail project development, mobilization of financial resources and implementation of rail projects for golden quadrilateral, port connectivity and project execution. RVNL mobilizes finances and forms project specific SPVs with private participation.
  • The railway projects include new lines, doubling, gauge conversion, railway electrification, metro projects, workshops, major bridges, cable stayed bridges, institution buildings etc.
  • Since 2003, RVNL has got 179 projects of which 174 are sanctioned for execution. Out of these, 72 have been fully completed for ₹20,567 cr. outlay and the balance are ongoing. They have an order book of ₹77,504 cr. as on Dec 2018 for 102 ongoing projects.
  • During FY18, they completed 885 RKm (Route kilometre) of project length which included 315 RKm of track doubling and 425 RKm of rail electrification.
  • RVNL earnings are from a management fee on the annual expenditure incurred for the execution of projects, of 9.25% for metro projects, 8.5% for other plan heads and 10% for national projects.
  • Their activities under the various plan heads can be classified as under:
    1. New lines: is augmenting the rail network by laying new lines to achieving seamless multi-modal transportation network across the country and connecting remote areas.
    2. Doubling: Doubling involves the provision of additional lines by way of doubling the existing routes to enable the Indian Railways to ease out traffic constraints of single line or construction of 3rd/4th line to increase the capacity. RVNL is a significant contributor to the doubling projects and has been contributing to a third of the total doubling being completed / commissioned on Indian Railways for the last three years. (Source: CARE)
    3. Gauge conversion: includes conversion of meter gauge lines to broad gauge railway lines.
    4. Railway electrification: This includes electrification of current un-electrified rail network and electrification on the new rail network, generally from diesel run trains.
    5. Metro projects: This includes setting up of metro lines and suburban network in larger cities.
    6. Workshops: This includes mfg. facilities, and workshops for repairing and mfg. rolling stock.
    7. Others: This includes but is not limited to construction of traffic facilities, railway safety works (building of sub-ways in lieu of crossings), other electrification works, training works, surveys, construction of bridges including rail over bridges, etc.
  • As a PMC (Project Management Consultant) firm, its services comprise of: (i) project development and execution of works related to creation of rail infrastructure; (ii) creating project-specific SPVs for encouraging private participation in the funding of railway projects; (iii) undertaking execution of railway projects under specific financial arrangement for the MoR and other Govt. departments; (iv) and other ancillary services like bankability studies for projects and preparation of detailed project reports.
  • It has an asset light model where the contractor identified for project execution brings in all the people resources and machinery required.
  • RVNL has a lean organization with only 541 employees of which 150 are regular and 391 are on deputation and may return to their home employer over time.
  • Leadership in RVNL is Pradeep Gaur (53) is CMD, Ajay Kumar (56) is Director (Personnel), Vijay Anand (59) is Director (Projects) and Arun Kumar (59) is Director (Operations). They are all professionals with experience in Indian Railways and Metro corporations.

Financials and Segments

  • We can see a solid growth of financials. FY19 so far does not look good, but we typically see H2 and Q4 as better than H1. See 4 year financials of RVNL in Fig 1.
  • The emphasis in RVNL is on new lines, lines doubling and Metro projects. See business segments as reflected by the Order Book as on 31st Dec 2018 in Fig 2.

jainmatrix investments, RVNL IPO

Fig 1- RVNL FY18 Financials
jainmatrix investments, RVNL IPO
Fig 2 – RVNL Order Book Segments

Industry thoughts:

  • Over the last few decades, the Indian Railways (IR) has not developed as fast as Roads, Ports and Airline sectors. It has struggled with its public service role as the dominant transporter of passengers. Most of the passenger services are priced at a discount and profits are from the goods services.
  • However capacity constraints like tracks have forced IR to de-emphasize goods services.
  • Productivity improvements have suffered in IR due to large and ageing workforce, legacy organization issues, weak governance in the past and slow decision making. Corruption has been an issue in IR in recruitment, private contracts and public services.
  • Computerization has helped improve the Reservation system in IR. However there is still a long way to go in passenger capacity utilization, flexible pricing and ease of access.
  • In recent times we have seen a dramatic improvement on many of these parameters in IR.
  • In 2016, IR announced a capex plan of Rs 8,60,000 cr. over 5 years i.e. 2016-20. The capex plan is 90% more than the capital outlay in the previous 15 years.
  • IR may be a critical element of India’s future growth story if it improves productivity, technology upgrades, goods transportation focus, financial sensitivity and improves services.
  • RVNL is a key growth arm of IR and may have a good role to play in the transformation of IR in terms of capacity increase, new tech initiatives, metro projects, high speed train lines, etc.
  • RVNL is also one of the second generation PSU firms that are lean in terms of employees, have a sharp business focus and outsource routine tasks to firms and have high productivity.
  • MoR has under it group firms Indian Railways, Concor, RITES Ltd., IRCON, IRFC and RVNL.
    • IR is the monopoly operator of rail based passenger and goods transportation services.
    • Concor is a listed container focused transport firm running multi modal services.
    • IRCON is a multi national consultancy firm active in transportation and infra, listed recently.
    • RITES is a turnkey construction firm active in Rail and non-rail infra areas, listed recently.
    • Indian Railway Finance Corporation (IRFC) is the dedicated financing arm of the Indian Railways for mobilizing funds from domestic as well as overseas Capital Markets.
    • In this comparison it is clear that RVNL has a focus on India based Railways related work as a PMC consultant. There is little overlap with group firms.

Benchmarking

We benchmark RVNL against other comparable Indian Railway firms, and also KEC which is a private sector infra EPC firm. See Exhibit 3.

jainmatrix investments, RVNL IPO

Exhibit 3 – Benchmarking

  • The PE post IPO is low. This provides a safety net for IPO investors.
  • Return ratios are good among the PSU pack.
  • Debt is high but this is expected from an infra projects firm. Also it is a pass through debt, with IR making the payments as per schedule.
  • 3 year growth of revenues and PAT is excellent.

Positives for RVNL and the IPO

  • We have seen a flurry of new initiatives in IR and a slew of new projects and technology initiatives. The GoI is serious about change. So RVNL may see acceleration in business.
  • Many private sector suppliers to IR have reported good growth in orders booked and revenues, across parts supply, and projects related to track laying and electrification. Many of these initiatives may be run by RVNL. Also it is notable that GoI is procuring from reputed private sector firms and taking their help to ramp up its operations.
  • RVNL is a lean and productive firm, and with this listing, may be allowed to chart an Indian Railways independent part to growth and impact. Infra development is a high potential sector.
  • It has attractive valuations with low PE and PB, moderate return ratios and a high 3 year revenue and PAT growth. The over 4%+ dividend yield is good.
  • An order book of Rs. 77,500 cr. gives business visibility of 10 years.
  • BV of Rs. 4,062 cr., and BVPS of Rs. 19.4/share is close to IPO price.

Risks and Negatives for RVNL and the IPO

  • Typically infra projects have issues like land acquisition and govt. clearances which delay execution. This is true for railway projects too with suburban and metro projects.
  • Funding of infra projects is underdeveloped in India. Long term funds from insurance and pension firms do not flow smoothly to infra, so projects become riskier with shorter term and more expensive funding. It is also exposed to financial variations like the current NBFC liquidity issue.
  • On many parameters IR is weak when compared internationally, such as speed of trains, passenger services in trains and at stations, etc. Conversely many improvements are possible.
  • The MoR and IR have been slow to grow in the Metro segment in India. As a specialized suburban train, the Metro is seen as an essential urban solution in Tier 1, 2 and 3 towns.
  • As a MoR firm, with IR as the key group firm, RVNL may be constrained by their slow approvals and permissions. There are worries around political compulsions in MoR.
  • Also RVNL has got projects by default from IR in the past due to relationship and structure. However in future and after RVNL listing, the flow of new projects is not assured.
  • There is a contingent liability of Rs. 3774 cr. This is due to a demand from a contractor. However RVNL feels that the demand is not as per agreement, also if the charge is enforced, it will add to the project cost and be reimbursed by respective clients.
  • H1 FY19 performance indicates no growth over FY18, however financials for PSU could be skewed towards H2 and Q4 which is usually the best quarter for infra/ GoI firms.
  • Of the 10 IPOs made by PSUs in the last 2 years, only 2 have generated positive returns. Balance 8 are down 30% on average. IRCON is down 16% since listing.
  • Political risk: With elections due in 1-2 months, we note that RVNL has accelerated performance in the current term of GoI. A change in leadership or party in power at MoR may affect future growth.

Overall Opinion and Recommendation

  • Infrastructure is a crying need in India. With Airlines, Roads and Ports sectors making good progress, the final frontier is the Indian Railways. The sleeping giant of IR appears to be getting up in the last few years.
  • RVNL represents the new initiatives, new technologies and expansion projects for IR. The current path is of acceleration, ambitious growth and standardization across India. The challenge is to get IR to grow in double digits, improve productivity, cover the country better and lower costs.
  • Valuations are attractively low with a FY18 PE of 6.9x for the IPO. A good kicker should come from Q4FY19 results and listing gains in a positive market.
  • Governance appears good and transparent within the PSU limitations.
  • Key risks are 1) Change in Central Govt. 2) De-emphasis on infra and railways by govt. 3) Issue of contingent liability 4) Weak infra funding environment.
  • Opinion: Investors can SUBSCRIBE to this IPO with a listing gains and 2 year perspective.

Disclaimer

This document has been prepared by JainMatrix Investments Bangalore (JM), and is meant for use by the recipient only as information and is not for circulation. This document is not to be reported or copied or made available to others without prior permission of JM. It should not be considered or taken as an offer to sell or a solicitation to buy or sell any security. The information contained in this report has been obtained from sources that are considered to be reliable. However, JM has not independently verified the accuracy or completeness of the same. JM has no stake, ownership or known financial interests in RVNL or any group company. Neither JM nor any of its affiliates, its directors or its employees accepts any responsibility of whatsoever nature for the information, statements and opinion given, made available or expressed herein or for any omission therein. Recipients of this report should be aware that past performance is not necessarily a guide to future performance and value of investments can go down as well. The suitability or otherwise of any investments will depend upon the recipient’s particular circumstances and, in case of doubt, advice should be sought from an Investment Advisor. Punit Jain is a registered Research Analyst under SEBI (Research Analysts) Regulations, 2014. JM has been publishing equity research reports since Nov 2012. Any questions should be directed to the director of JainMatrix Investments at punit.jain@jainmatrix.com.

HDFC AMC IPO – A Quality Asset

  • Date 24th July; IPO Opens 25-27th July at Rs. 1095-1100
  • Valuations: P/E 32.3 times TTM, P/B 10.7 times (Post IPO)
  • Mid Cap: Rs. 23,300 cr. Mkt cap
  • Industry – Asset Management
  • SUBSCRIBE for the IPO

Summary

  • Overview: HDFC AMC is the #2 player among AMCs by AUM and #1 by profits. HDFC operates as a JV between HDFC and Standard Life Investments. HDFC is one of India’s leading finance companies. Revenues and profit for FY18 were Rs. 1,867 cr. and Rs. 722 cr. HDFC revenues, EBITDA and PAT grew at 19.9%, 19.2% and 19.1% CAGR in 5 years. The Indian mutual fund industry is expected to grow at a CAGR of 20% between FY18 and FY22, due to buoyant capital markets, and a shift from physical to financial assets. Valuations in terms of P/E are 32.3 times, P/B at 10.7 times and market cap/AUM at 8% are high. However we have seen that in emerging sectors/ industries the excelling high quality players can command very high valuations. So a good track record, robust financial performance, sectoral tailwinds, reputed management team and good promoter identity makes this IPO attractive.
  • Risks: 1) High Valuations 2) Regulatory risks 3) Competition can impact margins 4) Macro concerns
  • Opinion: Investors can SUBSCRIBE to this IPO with a 3 year perspective.

Here is a note on HDFC Asset Management Company (HDFC) IPO.

IPO highlights

  • The IPO opens: 25-27th July 2018 with the Price band: Rs. 1095-1100 per share.
  • Shares offered to public number 2.54 crore. The FV of each is Rs. 5 and market Lot is 13.
  • The IPO is of Rs. 2,800 cr. for 12% equity by current promoters HDFC Ltd. and Standard Life Investments UK, with no dilution. HDFC Ltd. and Standard Life are selling 4.05% and 7.96% of shares.
  • The Promoter group (HDFC and Standard Life) own 95% in HDFC which will fall to 83% post-IPO, ie. 53% and 30% in resp. HDFC is a well-known Indian NBFC and is the holding company into financing the purchase or construction of houses, commercial real estate, etc. in India.
  • The IPO share quotas for QIB, NIB and retail are in ratio of 50:15:35.
  • The unofficial/ grey market premium for this IPO is Rs. 370-380/share. This is a positive.

Introduction to HDFC AMC

  • HDFC AMC is a leading Indian asset management firm into Mutual Funds and PMS Advisory. It is a JV between HDFC Ltd and Standard Life Investments. HDFC Ltd. is a leading Indian housing finance firm.
  • Revenues and profit were Rs. 1,867 cr. and Rs. 722 cr. for FY18. It has 1,010 employees out of which 58% are in sales and 29% are in client services. It had an AUM of Rs. 2,92,000 cr. in FY18. It is the most profitable AMC in India. It is the largest AMC in India in terms of equity-oriented assets and has consistently been among the top 2 AMCs in India in terms of total average AUM since Aug 2008.
  • The equity-oriented and non-equity-oriented assets are Rs. 1,50,000 cr. and Rs. 1,42,273 cr. resp. of total AUM. HDFC AUM has grown at 25.5% CAGR over FY13-18. Their proportion of equity-oriented AUM to total AUM is 51.3%, higher than the industry average of 43.2%. As equity schemes have a higher fee structure compared to non-equity schemes, the product mix helps achieve higher profits.
  • The market share of AUM is 13.7% and of active equity AUM is16.8% among AMCs see Fig 1c.
  • HDFC offers a large suite of savings and investment products across asset classes, which provide income and wealth creation opportunities to customers. In FY18, they offered 133 schemes classified as 27 equity-oriented schemes, 98 debt schemes (including 72 fixed maturity plans FMP), three liquid schemes, and 5 other schemes (including ETF schemes and funds of fund schemes).
  • This diversified product mix provides them with the flexibility to operate successfully across various market cycles, cater to a wide range of customers from individuals to institutions, address market fluctuations, reduce concentration risk in a particular asset class and work with diverse sets of distribution partners which helps them expand their reach.

jainmatrix investments, hdfc amc ipojainmatrix investments, hdfc amc ipoFig 1(a) – HDFC AUM split -June 2018 (b) HDFC Segment revenues c) Market share /Note – QAAUM is Quarterly Average AUM /Click to enlarge image view. 

  • HDFC also provides portfolio management and segregated account services, including discretionary, non-discretionary and advisory services, to high networth individuals (HNIs), family offices, domestic corporates, trusts, provident funds and domestic and global institutions. As of FY18, they managed AUM of Rs. 6,474 cr. as part of their PMS and segregated accounts services’ business.
  • HDFC had a total of Live Accounts of 81 lakh as of FY18, and their Monthly Average AUM from individuals was 62.2% of their total MAAUM, compared to the industry average of 51.4%.
  • A key element of their strategy is to promote a customer-centric culture that spans across all aspects of their business. As of FY18, they served customers in over 200 cities through their pan-India network of 209 branches (and a Dubai office) and service centers of their registrar and transfer agent, which is supported by a network of 65,000 empaneled distribution partners across India, consisting of independent financial advisors, national distributors and banks.
  • Leadership is Deepak Parekh (Chairman), Keki Mistry (Non-Exec Director), Milind Barve (MD), Prashant Jain (CIO) and Piyush Surana (CFO).

Promoter – HDFC Ltd and Group – Snapshot and Financials

  • The HDFC group is a known financial conglomerate in India, with presence in housing finance, banking, life and non-life insurance, asset management, real estate funds and education finance. Listed companies of the group include HDFC Ltd., HDFC Bank, HDFC Standard Life Insurance Co. and GRUH Finance. HDFC Ltd is the holding company and is also engaged in financing the purchase or construction of residential houses and commercial real estate.
  • Income and PAT has grown at 14.1% and 19.5% CAGR resp. over 5 years.

jainmatrix investments, hdfc amc ipoFig 2 – HDFC Financials

  • HDFC Ltd. share price gained 19.5% CAGR over the last 5 years and CMP is Rs 1,970.
  • HDFC Ltd. has visible signs of pick-up in demand for mortgage loan led by improving affordability, attractive incentive from PMAY scheme and introduction of RERA which augurs well for sustained growth in loan book for HDFC over the next 3-5 years. Further, the performance of its various financial business subsidiaries/associates has improved substantially over the last few quarters.
  • The key risks are 1) Aggressive competition among the HFCs 2) Unstable interest rate environment.
  • HDFC has a market cap of Rs 3,33,106 cr. to be ranked #6 in India.
  • HDFC is a prestigious group with good ethics. It has rewarded shareholders and performed well over decades. The listed subsidiaries of HDFC Ltd. have generally retained these qualities.

News, Updates and Strategies of HDFC AMC

  • The average cost of acquisition of equity shares for HDFC ltd. has been Rs 19.53 over 2000-18 and for Standard Life Investments it is Rs 15.01 over same period.
  • HDFC’s business strategy is as follows: 1) Maintain strong investment performance 2) Expand their reach and distribution channels 3) Enhancement of product portfolio. 4) Invest in digital platforms to establish leadership in the growing digital space.
  • HDFC has grown by acquisition, taking over Morgan Stanley AMC (2014) and Zurich India MF (2003).
  • HDFC AMC sold its shares worth almost Rs 150 cr. to distributors in April 2018 before the upcoming IPO. These shares were offered to 190 distributors and advisers at Rs. 1,050/share. But SEBI in July 2018 directed HDFC to scrap this placement and to return the money it had collected with a 12% interest. These shares were then acquired by PE firm KKR paving the clearances for the IPO. Prior to the share allotment, HDFC had sought approval for a special quota for distributors in its IPO, but SEBI rejected the proposal then because it was against a separate quota for distributors.

MF Industry Outlook in India

  • The economy has seen financial events such as demonetization, RERA implementation, GST and a crackdown on black money and shell companies. All these have rekindled interest in financial assets as compared to real estate and gold which were the most popular earlier.
  • Penetration of equities remains low, with only 2% of population having a demat or equity /MF ownership. Gold & real estate hold a large proportion of savings but have generated weak returns.
  • The regulations and disclosures around MFs have ensured good traceability and audit trails. SEBI has promoted MFs as good entry level equity and debt products, and MF asset growth has been good.
  • The MF industry’s AUM grew at a CAGR of 24.9% from Rs. 7 lakh cr. in FY13 to Rs. 21.4 lakh cr. as of Mar 2018, supported by strong investor inflows of Rs. 9 lakh cr. FY17 & FY18 have been remarkable for the industry, attracting around 68% of the Rs. 9 lakh cr. net inflow, with equities leading the charge. Equity-oriented funds (including balanced and excluding ETFs) attracted 60% of the total net inflows in FY17 & FY18. Supported by these strong inflows, growing participation from individual investors and rising equities, the assets surged 42.3% in FY17 and 21.7% in FY18. During FY18, the fresh investments in MFs grew by 22.2% to Rs. 3.9 lakh cr. in the FY 2018.
  • The growth in the AUM has been supported by a favorable macro environment, the rising of capital markets, foreign fund inflows as well as growing investor awareness.
  • Today there are 41 AMCs operating comprising 7 promoted by PSB’s, 2 by financial institutions, 25 by private sector and 7 by foreign players (including JV’s). The Indian MF industry is concentrated with the 10 large AMCs having 80% of the industry AUM. ICICI Prudential AMC, HDFC, Reliance, Birla Sun Life and SBI Funds are the 5 largest with 57% of AUM.
  • The MF industry is expected to grow at a CAGR of 20% between FY18-22, with the AUM expected to grow to Rs. 45 lakh cr. by Mar 2022. Growth rates are expected to be higher in FY19 due to buoyant capital markets and increase in retail participation, after which it may taper down. Stock broking firms too perform very well when markets are in a bullish phase.
  • Global asset management firms have struggled in India as independent MF firms. Many sold out and exited. They have had a better success rate on partnering with Indian firms as the MF JV promoter.
  • India’s MF penetration (AUM to GDP) at 12.8% is much lower than the world average of 62% and also lower than developed economies like US (101%), France (76%), Canada (65%) and UK (57%) and even emerging economies like Brazil (59%) and South Africa (49%). This is expected to grow fast.

Financials of HDFC

  • HDFC revenues, EBITDA and PAT grew at 19.9%, 19.2% and 19.1% CAGR in 5 years, see Fig 3.
  • Margins for 5 years are flat but high double digits due to good exposure to equity assets. Given the high revenue growth, flat margin is a good achievement. Absolute profits have grown fast.
  • HDFC had a RoE of 33.4% in FY18 and RoCE of 49.1%. The return ratios are high and excellent.
  • HDFC paid dividends of Rs. 405 cr. in FY18 (including DDT). The dividend payout ratio is high at 56%.
  • HDFC has been Free Cash Flow positive in the last 5 years. This is good CF management, see Fig 4.
  • 76% of the pre IPO equity shares have been pledged by a non-promoter shareholder. None of the shares held by the promoter or promoter group have been pledged.
  • The issue has been priced at Rs. 1,100 share which translates to a P/E of 32.3 times. The market cap/AUM is 8%. This is aggressive and makes the issue expensive.

jainmatrix investments, hdfc amc ipoFig 3 – Financials, Fig 4 – HDFC Cash Flow jainmatrix investments, hdfc amc ipo

Benchmarking

We benchmark HDFC against other Indian and global AMCs. See Exhibit 5. Only Reliance Nippon is a pure AMC, other Indian firms have NBFC and broking businesses. US firms are for comparison.

  • The asking PE and P/B is high. HDFC has moderate 3 year sales and PAT growth. The NBFC business segments of Indian firms has allowed faster growth.
  • The Debt is low, but again for non AMC business, the debt is necessary so it not comparable.
  • The margins are at the higher end amongst most peers from the industry. This is a positive.
  • The return ratios historically also have been very high and robust among comparable peers.
  • Note – The USA companies data is for CY2017, Exchange rate is Rs/$ of Rs 68.

jainmatrix investments, hdfc amc ipo Exhibit 5 – Benchmarking

Positives for HDFC and the IPO

  • HDFC has a market leadership in the Indian MF industry of #2 on AUM and #1 on equity AUM. Their market share of total AUM was 13.7% and of actively managed equity-oriented AUM was 16.8%.
  • HDFC has a trusted brand and strong parentage of HDFC group. The holding company and the 3 other listed group firms have done well on the stock markets. HDFC Standard Life Insurance Co was the most recent to list in Nov 2017. It has also done well post listing, up 65% on IPO price.
  • HDFC MFs have performed well with a solid approach, philosophy and risk management.
  • HDFC has a superior and diversified product mix distributed through a multi-channel distribution network. Their product mix enables them to operate through various market cycles, cater to specific customer requirements and reduce concentration risk. Strong distribution relationships also ensure the commitment of the channels for new launches and investor support and confidence.
  • HDFC has consistently had assets and profit growth.
  • HDFC has an experienced and stable management & investment teams.

Risks and Negatives for HDFC and the IPO

  • The valuations are high in terms of P/E, P/B and market cap/AUM.
  • HDFC had overextended its distributor benefits pre-IPO, and was ordered by SEBI to avoid a conflict of interest and revoke the distributor allotment of shares. HDFC realizes the importance of distributors, but needs to take care to not cross the legal or market accepted limits.
  • The global macros are looking cloudy. Trade war tensions between USA – China can escalate. A diplomatic conflict with Iran is playing out. Oil prices are trending higher. Brexit threatens the UK economy. Europe and the Euro are looking weak with poor economic outcomes for the region. In this situation a sharp deterioration on any of these parameters can affect Indian investment climate.
  • AMCs are closely regulated by SEBI and is subject to changes or tightening of norms. For example in July 2014, the holding period for long-term capital gains tax on debt MFs was increased from 12 to 36 months. It is possible that regulatory changes can affect their business in future.
  • SEBI in Oct 2017 issued a circular to categorize and rationalize the MF schemes. MFs are classified into 5 groups, i.e., equity, debt, hybrid, solution oriented and other schemes. These 5 groups have 36 categories of schemes, and only 1 scheme per category is permitted by a MF. This has resulted in many MF schemes being merged, renamed and repurposed in the industry. HDFC has complied with the SEBI changes, but the rationalization may have a adverse impact on their brands and business.
  • Competition from existing and new MFs could reduce their market share or put pressure the fees.
  • The tax on Long term Capital Gains from equity was introduced in budget 2018 in Feb at 10%, from zero earlier. This caused a correction in markets, particularly the mid and small cap stocks.
  • Competition to the MF industry is from alternatives like the PMS industry, AIF/ Hedge Funds, Private equity markets and direct equity advisory services. Many of these are the next steps for MF investors after they have started their investment journey with MFs.
  • HDFC has defocused from PMS and other segments and appears to focus on Mutual Funds.

Overall Opinion and Recommendation

  • In India there is a massive trend of financialization of assets, a move away from physical / guaranteed assets like real estate, gold and FDs, towards equity and debt.
  • The MF industry is witnessing a massive growth with total AUM’s growing rapidly in the last 10 years. The number of new investors and their portfolios has grown significantly from retail investors. In fact the domestic driven MF industry has emerged as a foil to the FII investors in India.
  • The #2 player by AUM, HDFC AMC is well managed financially, has a great brand, high margins and return ratios, low CAPEX and cost structure.
  • Valuations look high in terms of PE 32.3 times, P/B 10.7 times and market cap/AUM at 8%. However we have seen that in emerging sectors/ industries the excelling high quality players can command very high valuations (think Avenue Supermarts in Retail and group firm GRUH Finance in rural home loans). HDFC certainly faces high competition, but can pull ahead and become #1 by AUM in the next few years. So a good track record, robust financial performance, sectoral tailwinds, reputed management team and strong promoter identity makes this IPO attractive.
  • Opinion: Investors can SUBSCRIBE to this IPO.

Disclaimer

This document has been prepared by JainMatrix Investments Bangalore (JM), and is meant for use by the recipient only as information and is not for circulation. This document is not to be reported or copied or made available to others without prior permission of JM. It should not be considered or taken as an offer to sell or a solicitation to buy or sell any security. The information contained in this report has been obtained from sources that are considered to be reliable. However, JM has not independently verified the accuracy or completeness of the same. JM has no stake ownership or known financial interests in HDFC AMC. He has a stake in HDFC Bank. Punit Jain may apply for this IPO in the Retail category. Neither JM nor any of its affiliates, its directors or its employees accepts any responsibility of whatsoever nature for the information, statements and opinion given, made available or expressed herein or for any omission therein. Recipients of this report should be aware that past performance is not necessarily a guide to future performance and value of investments can go down as well. The suitability or otherwise of any investments will depend upon the recipient’s particular circumstances and, in case of doubt, advice should be sought from an Investment Advisor. Punit Jain is a registered Research Analyst under SEBI (Research Analysts) Regulations, 2014. JM has been publishing equity research reports since Nov 2012. Any questions should be directed to the director of JainMatrix Investments at punit.jain@jainmatrix.com.

Varroc Engineering IPO – An Auto-matic BUY

  • 25th June 2018
  • Mid Cap of Rs. 13,000 cr.
  • Industry – Auto Ancillary; IPO Opens 26-28th June at Rs. 965-967
  • Valuations: P/E 28.9 times TTM
  • Advice: SUBSCRIBE

JainMatrix Investments, Varroc IPOSummary of Report

  • Overview: Varroc Engineering is a global tier-1 auto component firm. They design, make and supply exterior lighting systems, plastic and polymer, electricals-electronics and precision metallic components to passenger car, CV, 2W, 3W and off highway vehicle OEMs directly worldwide.
  • India and global revenues are split 35:65 so they have good international presence.
  • Varroc’s FY18 revenue, EBITDA and PAT were Rs. 10,417 cr., Rs. 985 cr. and Rs. 451 cr. resp., and they grew at 13.1%, 12.9% and 18.2% CAGR in 4 years.
  • At a FY18 PE of 28.9x, valuations appear fair. It has a healthy balance sheet with conservative financials. It has good Indian and global presence.
  • Key Risks: 1) High Competition 2) Currency Risks 3) Downturn in macro-economic environment.
  • Opinion: Investors can SUBSCRIBE to this IPO with a 2 year perspective.

Other Auto Sector reports from JainMatrix Investments

Here is a note on Varroc Engineering (Varroc) IPO. You may also Download the PDF file – JainMatrix Investments_Varroc Engineering IPO_June2018

IPO highlights

  • The IPO opens: 26-28th June 2018 with the Price band: Rs. 965-967 per share.
  • Shares offered to public number 2.01 cr. The FV of each is Re. 1 and market lot is 15 numbers.
  • The IPO will raise Rs. 1,955 cr. while selling 15% of equity. The offer will be completed via an Offer for Sale (OFS) by existing shareholders of Rs. 1,955 cr. and there is no fresh issue of shares.
  • The promoter (Tarang Jain) owns 86.3% of Varroc which will fall to 85% post-IPO. The other investors 1) Omega TC Holdings (a PE firm) and 2) Tata Capital Fin. Serv. are fully exiting their 13.7%.
  • The selling shareholders are both Tata group firms that invested in Varroc in Mar 2014. The cost of acquisition was Rs. 162.4/share, so they are getting ~5x returns in 3+ years.
  • The IPO share quotas for QIB, Non Institutional Buyer (NIB) and Retail are in ratio of 50:15:35.
  • The unofficial/ grey market premium for this IPO is Rs. 55-60/share. This is a positive.

Introduction

  • Varroc is a global T1 (tier-1 companies directly supply to OEMs) automotive component group. It’s FY18 revenue, EBITDA and PAT were Rs. 10,417 cr., Rs. 985 cr. and Rs. 451 cr. resp.
  • They design, mfg. and supply exterior lighting systems, plastic-polymer, electricals-electronics, and precision metal components for PVs, CVs, 2W, 3W and off highway vehicle OEMs worldwide.
  • They are the 2nd largest Indian autocomp. group and a leading T1 mfg. and supplier to Indian 2-3W. It is also the 6th largest global auto lighting firm with 4% market share and $1 billion in sales and one of the top 3 independent exterior lighting players (by market share in 2016). Source: News reports.
  • Varroc started with the polymer business in 1990, and grew organically by adding business lines, like electrical and metallic and diversified products. Inorganic expansions – in 2012 Varroc acquired Visteon’s global lighting business, now known as Varroc Lighting Systems (VLS). In 2013, they acquired Visteon’s holding in a 50/50 JV with Beste Motor Co. Ltd. for auto lighting in China, Varroc TYC (China JV). They acquired 70% in auto accessories firm Team Concepts in 2018.
  • Varroc has 2 primary business lines, namely (i) VLS with the design, mfg. and supply of exterior lighting systems to passenger car OEMs worldwide. VLS has a portfolio of lighting products including Halogen, Xenon/high-intensity discharge, LED, OLED, Flex LED and LED pixel headlamp, catering to 5 segments in external automotive lighting. (ii) India Business with the design, mfg. and supply of auto components in India, to 2W and 3W OEMs, including exports. This offers products across 2 product lines, polymers/plastics, electrical/ electronics and metallic components. See Fig 1.

Fig 1- Varroc’s FY18 Segment Revenue/ Fig 2 – Varroc Geographic Revenue

  • Varroc has a global footprint of 36 mfg. facilities spread in 7 countries, with 6 facilities for the VLS, 25 for their India Business and 5 for others. In FY18, their largest customer contributed 18.6% of their revenue and their top 5 customers contributed 59.9% of revenue.
  • VLS has relationships with auto OEMs across the premium, mid-range and mass market pricing spectrum, like Ford, Jaguar Land Rover, Volkswagen, Renault-Nissan-Mitsubishi, Groupe PSA, FCA, a European car and an American electric car maker. The global lighting business has 185 patents.
  • Within India the 25 mfg. and 5 R&D centers form a footprint in the auto hubs, close to customers. Varroc has supplied to Bajaj Auto for 28 years across product lines, it is the largest customer contributing 18.6% and the top 6 are 50%. Other 2W customers are Honda, Royal Enfield, Yamaha, Suzuki and Hero. Export are to global 2W makers namely KTM and Volvo.
  • Leadership is Tarang Jain (MD age 56), Naresh Chandra (Chairman, 83), Ashwani Maheshwari (CEO India), T.R. Srinivasan (CFO) and Arjun Jain (head, electricals, 28). Tarang, Naresh and Arjun are related as Promoter, father and son. Stephane Vedie is the CEO of Varroc lighting, based out of USA.

Endurance Technologies – Snapshot and Varroc connection

  • Endurance Technologies is an India-based company, which makes aluminum casting (including alloy wheels), suspension, transmission and braking products. Endurance is connected with Varroc as Anurang Jain (MD Endurance) is the twin brother of Tarang Jain (Founder promoter of Varroc).
  • Income and PAT has grown at 11.6% and 17.5% CAGR resp. over 5 years. Endurance Tech had  its IPO in Oct 2016 at Rs. 472, the share has gained 176% since to Rs. 1,304.

JainMatrix Investments, Varroc IPO

  • Endurance Tech is perceived as a stable, fast growing and a high quality firm.
  • The Varroc promoters are related to the promoters of Bajaj Auto & Endurance. However even though Endurance Tech is owned by a brother, the two firms have separate businesses and different product offerings for the same customers, so they don’t compete directly. The two brothers had an amicable business split in 2002.

News, Business Notes and Strategies of Varroc

Varroc’s business strategies are:

  1. To focus on growth markets for VLS with new plants in Brazil and Morocco, to supply the South American, southern European and North African markets.
  2. To focus on increasing customer revenue for the India business.
  3. To invest in R&D, design, engineering and software capabilities and capitalize on future trends.
  4. Pursue strategic JV’s and inorganic growth opportunities.
  • In Feb 2018, Varroc entered into a JV in India with Dell’Orto S.p.A., a customer, for the development of electronic fuel injection control systems for 2W’s and 3W’s.
  • Varroc is setting up a mfg. facility in Brazil, one in Morocco and 2 in India.
  • Varroc in June 2018 opened an office in Tokyo to expand its global footprints. With this, they can now target Japanese OEMs for project management and engineering, lighting and electronics.
  • As per Tarang Jain, in the lighting business they want to be in the top 3 globally, while for the 2W business, they want to grow in India and also tap South-East Asia as they are the biggest markets. The revenue target is Rs. 20,000 cr. by FY21, double from FY18, through organic & inorganic growth.
  • Organic investments are going be about Rs 850 crore annually. Varroc has four successful acquisitions in the past, of the lighting business of US-based Visteon Corp, Tri OM for 2W lighting, IMES Poland & Italy for forging business and a small Indian firm which indicates their M&A success.
  • Varroc’s chief of Sales & Marketing Vikas Marwah quit in Apr 2018 after just 5 months. It appointed T R Srinivasan in Oct2017 as CFO taking over from B Padmanabhan, who retired after a 10-year stint.
  • Varroc is eyeing surface LEDs to drive future growth. Surface-LED technology uses thin layers of micro-optic filters and conventional LED light sources to achieve the homogeneous appearance generally associated with OLEDs. The metallic division is also targeting to grow 30% CAGR.

Automotive Exterior Lighting Industry Outlook

  • The global auto exterior lighting market had revenues of USD 17.8 bn. in 2016. Revenue grew 4.5% (FY11-16) CAGR and is expected to grow at 4.3% (FY16-21).
  • Globally, the market growth drivers are (a) increased LED penetration (b) technology innovation (c) design differentiation and (d) higher lighting content per vehicle.
  • The global auto exterior lighting industry comprises more than 20 players around the world. The main 8 players are Koito Mfg. Co., Magneti Marelli, Valeo, Stanley Electric Co., Hella KGAA Hueck & Co, Varroc Lighting Systems, SL Corporation and ZKW, which generated US$16.3 bn. in revenue, representing 91% of the total global auto exterior lighting revenue.
  • Varroc’s market share in the exterior lighting segment in India at present is reported to be 8%.

Financials of Varroc

  • Varroc’s revenues, EBITDA and PAT grew at 13.1%, 12.9% and 18.2% CAGR in 4 years, see Fig 4.
  • The 3 year PAT growth is modest. Varroc as a part of its strategy focuses on cost optimization.
  • Margins are in a range of 7.5-9.5% for EBITDA and 3-4.5% for PAT over the last 4 years. The margins are low, but at par with other OEM suppliers in the industry.

JainMatrix Investments, Varroc IPO

Fig 4 – Financials

  • Note: The FY15 figures are Indian GAAP, and FY16-18 are IND-AS numbers.
  • Varroc has a RoE of 15.9% for FY18 while the 3 year average RoE stood at 16.1% (FY16-18). The RoCE stands at 16.2% for FY18. These return ratios are moderate.
  • Varroc has been Operational Cash flow (CFO) positive in last few financial years. This is a positive. They have typically been investing available CFO for CAPEX i.e. funding expansion plans from internal accruals. It has generated FCFE in the last 3 years. See Fig 5.
  • The current D/E ratio is 0.42 which is moderate. There is ample room for the management to grow faster by raising debt. However Varroc has guided that they would not want a D/E of over 1.
  • The dividend payout ratio is low because of CAPEX needs, the FY18 ratio was 1.37%.

JainMatrix Investments, Varroc IPO

Fig 5 – Varroc’s Cash Flow  

Benchmarking

We benchmark Varroc against other comparable Indian auto ancillary companies. See Exhibit 6.

  • The PE post IPO is fair. PE ratio of Varroc is in the mid-range amongst its peers.
  • The 3 year sales and PAT growth are next to only Motherson indicating stability.
  • Margins in FY18 have improved and are also in the mid-range. The RoE for FY18 stood at 15.9% and RoCE at 16.3%. The return ratios are fair, not very low. The dividend yield at 0.05% is low.
  • In many ways, Varroc appears to be executing a strategy similar to Motherson, but are at about 1/5 the size in terms of revenue, PAT and target market cap.

JainMatrix Investments, Varroc IPO

Exhibit 6 – Benchmarking

Positives for Varroc and the IPO

  • IPO pricing and valuations are fair and at lower end of the peers.
  • Varroc has shown good financial performance and operating efficiency recently.
  • The MD appears to be hiring professionals at the next level / reporting to him, which should strengthen the firm and enable it to grow to the next level.
  • Varroc has a consistent track record of organic and inorganic growth. It has strong customer relationships with high quality OEMs in India, NorthAm and Europe.
  • Varroc has a proven business model and strategy, as seen with the success of Motherson Sumi. There is ample room to grow for Varroc in the sector globally.
  • Strong competitive position in attractive growing markets for VLS.
  • Low cost, strategically located mfg. and design footprint. Varroc has located its facilities primarily in low-cost countries but near major auto markets. They are making investments to expand into Brazil and Morocco, which would keep costs low yet deliver easily to their customers.
  • Robust in-house technology, innovation and R&D capabilities. The VLS business has 964 engineers located in 9 R&D centers, which are located in the Czech Republic, India, China, Mexico, Germany, the USA and Poland. Their R&D teams are focused on quick adoption of technology, enabling them to grow their product portfolio in line with customer expectations and industry developments.
  • Focus on expansion in auto electronics, an important trend in the industry.
  • The Varroc teams including the MD have good experience in the auto component sector.

Risks and Negatives for Varroc and the IPO

  • General economic conditions like the global trade war and protectionism.
  • Auto ancillary sector is considered a working capital and an asset heavy business. New orders involve big additions to working capital, so Varroc will need to manage growth and financial health.
  • Competition is high and Varroc may face pressure on price or margins in future.
  • Varroc is subject to environmental and safety regulations that it has to adhere to.
  • Their success depends on the success and survival of the auto models launched by OEMs. Thus several key success factors for Tier-1 suppliers are out of their control.
  • Varroc’s business is dependent on certain principal customers, especially Bajaj Auto in India. Sales to their top 3 customers for VLS were 50.7% of revenue for FY18, indicating client concentration. However this is a typical auto B2B situation.
  • Labour unrest is always a challenge in a firm with many employees. We came across news of strikes or unrest in Varroc factories in Aurangabad in 2009 and 2017. However these were quickly resolved.

Overall Opinion and Recommendation

  • The Indian auto ancillary mfg. is a high potential space with fair domestic size and growth; there are also significant global opportunities. India has many competitive & comparative advantages, so many global auto firms have set up here; there is also a vibrant two wheeler OEM sector here.
  • In this sector, Varroc has grown to a good size, has improving margins and marquee customers. It has a healthy balance sheet with conservative financials. It has both Indian and global presence.
  • Management quality is excellent with a global vision, eye for controlled growth and financial prudence and in sync with key global auto trends. Governance appears good and transparent.
  • At a FY18 PE of 28.9x, valuations appear fair, but are not cheap. We do not see a near term gain.
  • Key risks are 1) High Competition 2) Currency Risks 3) Downturn in macro-economic environment.
  • Opinion: Investors can SUBSCRIBE to this IPO with a 2 year perspective.

DISCLAIMER AND DISCLOSURE

This document has been prepared by JainMatrix Investments Bangalore (JM), and is meant for use by the recipient only as information and is not for circulation. This document is not to be reported or copied or made available to others without prior permission of JM. It should not be considered or taken as an offer to sell or a solicitation to buy or sell any security. The information contained in this report has been obtained from sources that are considered to be reliable. However, JM has not independently verified the accuracy or completeness of the same. JM has no stake, ownership or any other known financial interests in Varroc or any group company. Neither JM nor any of its affiliates, its directors or its employees accepts any responsibility of whatsoever nature for the information, statements and opinion given, made available or expressed herein or for any omission therein. Recipients of this report should be aware that past performance is not necessarily a guide to future performance and value of investments can go down as well. The suitability or otherwise of any investments will depend upon the recipient’s particular circumstances and, in case of doubt, advice should be sought from an Investment Advisor. Punit Jain is a registered Research Analyst under SEBI (Research Analysts) Regulations, 2014. JM has been publishing equity research reports since Nov 2012. Any questions should be directed to the director of JainMatrix Investments at punit.jain@jainmatrix.com.

Indian Roads Sector – A Delightful Drive Ahead?

  • Date 26th April  
  • Industry – Roads Construction 

Summary

Here is a snapshot of the interesting Roads Sector. We sense a revival, and a number of players are active here.

Additional Roads Sector Reports from JainMatrix Investments

  • Please read our Feb 2018 report on HG Infra IPO by clicking on LINK.
  • And our July 2017 report – IRB Infra Developers – In Invit We Trust – LINK
  • Additionally do read our Aug 2016 report on Dilip Buildcon IPO by clicking on LINK.
  • We share a Nov 2015 Roads sector report – LINK

Introduction

  • The development of any nation depends on transportation networks, and this is applicable to India with its varied terrain ranging from mountains to plains to coast. Transportation includes Roads, Railways, Airlines and Shipping, however in this note we will focus on Roads.
  • India has the 2nd largest road network in the world, aggregating to 61 lakh kms. Roads are the most common mode of transportation and account for 86% of passenger traffic and 65% of freight traffic. In India, NHs with length of 1.04 lakh km are just 1.7% of the road network, but carry about 40% of the total road traffic. On the other hand, state roads and major district roads at the next level carry another 60% of traffic and account for 98% of road length.
  • There are 2 Govt. bodies which award road projects at the central level, NHAI which is in charge of the National Highway Development Programme (NHDP) and the Ministry of Road Transport and Highways (MoRTH), which covers those highways not under NHDP. In addition, it also awards projects under Govt. schemes like Left Wing Extremism (LWE) scheme (road development in Naxalite areas), Special Accelerated Road Dev. Programme for North-East Region (SARDP-NE), NH Interconnectivity Improvement Project (NHIIP), etc.

jainmatrix investments

Road Projects Progress

  • From Fig 1 and 2, we can see that road projects awarded and completed flattened out during FY12-FY14. Delays in land acquisition & receipt of environment/forest clearances, economic slowdown and cash flow issues faced by developers had adversely impacted the sector. From the Fig 3 below we can see the transition of project awarding to new modes over the last few years.

jainmatrix investmentsFig 1 – MoRTH projects Awarded / Fig 2 – NHAI projects / Source: MoRTH / NHAI ARs 

  • In FY16, the NHAI introduced the Hybrid Annuity model (HAM) as the earlier BOT-Toll based awarding caused financial distress to the developers and the EPC model involved high upfront investment of funds. In HAM, 40% the Project Cost is to be provided by the Govt. as ‘Construction Support’ to the developer during the construction period and the balance 60% as annuity payments over the operations period along with interest on outstanding amount. This model has received good response from industry and investors.

jainmatrix investmentsFig 3 – NHAI project awarded

  • CRISIL Research expects investment in road projects to double to Rs. 10,70,000 cr. over 5 years.
  • Investment in state roads are expected to grow steadily, and rise at a faster pace in case of rural roads, on account of higher budgets for Pradhan Mantri Gram Sadak Yojana (PMGSY) since FY16.
  • The GoI approved the Bharatmala program under which 53,000 kms of national highways have been identified to bridge critical infra gaps. It will give the country 50 national corridors as opposed to 6 at present. Phase I will be implemented from FY18-22 with 24,800 kms of construction expected.

Key Players

  • In Q4 FY18, the MoRTH had aggressively awarded projects to further accelerate the pace of road infra development. See the order book position of a few listed road developers, Fig 4 and Fig 5.

jainmatrix investmentsFig 4 – Order Books of Roads players / Fig 5 – Order Book FY18 / Fig 6 – Benchmarking 

  • Note: FY18# is the order book basis 9M FY18 data and documents available on the exchange.
  • In Fig 6, we have done a benchmarking exercise to compare a few sector players.

Conclusion

  • The development of road infra in India is witnessing great momentum. Robust demand, higher investments, favourable policies and government’s willingness has changed the face of the road sector in the country. The construction of roads per day hit a new high of 27 kms/day for FY18, which is much higher than what was achieved earlier.
  • The momentum of building a stronger road network in India is likely to improve as it generates mass employment and leads to significant growth in contribution to the GDP. Given the current roads sector scenario, investors should definitely not miss this exciting opportunity.

JainMatrix Knowledge Base:

  • See other useful reports on the right side panel and See Reports sections of the Menu.
  • Visit and Like JainMatrix FB or Follow on JainMatrix Twitter for reports

Do you find this site useful?

  • Visit the Investment Service page to find how you can get more. Or Click LINK
  • Register Now to get our Free reports and much more, on the top right of this page, or by filling this Signup Form CLICK.

Disclaimer

This document has been prepared by JainMatrix Investments Bangalore (JM), and is meant for use by the recipient only as information and is not for circulation. This document is not to be reported or copied or made available to others without prior permission of JM. It should not be considered or taken as an offer to sell or a solicitation to buy or sell any security. The information contained in this report has been obtained from sources that are considered to be reliable. However, JM has not independently verified the accuracy or completeness of the same. Punit Jain has positions in IRB Infra since Feb 2008 and H G Infra post listing. Other than this, JM has no known financial interests in IRB Infra or any other firm mentioned in the article. Neither JM nor any of its affiliates, its directors or its employees accepts any responsibility of whatsoever nature for the information, statements and opinion given, made available or expressed herein or for any omission therein. Recipients of this report should be aware that past performance is not necessarily a guide to future performance and value of investments can go down as well. The suitability or otherwise of any investments will depend upon the recipient’s particular circumstances and, in case of doubt, advice should be sought from an Investment Advisor. Punit Jain is a registered Research Analyst under SEBI (Research Analysts) Regulations, 2014. JM has been publishing equity research reports since Nov 2012. Any questions should be directed to the director of JM at punit.jain@jainmatrix.com.

ICICI Securities IPO – A Direct Purchase

  • Date 24th Mar; IPO Opens 22-26th Mar at Rs. 519-520
  • Valuations: P/E 34.6 times TTM
  • Large Cap: Rs. 16,750 cr. Mkt cap
  • Industry – Stock Broking
  • Advice: SUBSCRIBE

Summary

  • Overview: ICICI Securities is a technology-based securities firm that offers a wide range of services including brokerage, financial products distribution and investment banking. They have been the largest equity broker in India since FY14 by revenue and active customers in equities. ISec FY17 revenue, EBITDA and PAT were Rs. 1,404 cr., Rs. 580 cr. and Rs. 338 cr. resp. ISec revenues, EBITDA and PAT grew at 19%, 36% and 47% CAGR in 5 years.
  • ISec has a good brand, a top 5 market position, good synergy with ICICI Bank, a nationwide infra for supporting and growing its customer base and an excellent last 5 years and 9M FY18 financial performance where it has emerged as one of the leaders.
  • At a P/E of 34.6 times, the valuations of the IPO appear to be high. However earnings growth is likely to continue at a high rate. Superior RoE, high and improving margins, scalable business model, and sectoral tailwinds make this issue attractive.
  • Key Risks: 1) Cyclical industry 2) High and rising competition 3) No discount brokerage offering from ISec 4) Poor image
  • Opinion: Investors can SUBSCRIBE to this IPO with a 2 year perspective.

Here is a note on ICICI Securities (ISec) IPO. You may also read and save the report in a PDF file attached – JainMatrix Investments_ICICI Securities IPO_Mar2018

IPO highlights

  • The IPO opens: 22-26th Mar 2018 with the Price band: Rs. 519-520 per share.
  • Shares offered to public number 7.72 cr. The FV of each is Rs. 5 and market lot is 28.
  • The IPO will raise Rs. 4,017 cr. while selling 24% of post IPO equity. The offer will be an Offer for Sale (OFS) of Rs. 4017 cr. and there is no fresh issue of shares.
  • The promoter (ICICI Bank) owns 100% of ISec which will fall to 76% post-IPO.
  • ICICI Bank is the selling shareholder as it is the sole owner of the entire company. Out of the 7.72 cr. shares offered for sale, 38 lakh shares have been reserved for existing ICICI Bank shareholders. The IPO quotas for QIB, Non Institutional Buyer (NIB) and Retail are in ratio of 75:15:10, quite unusual.
  • The unofficial/ grey market premium for this IPO is Rs. 10-15/share. This is a positive.

Introduction

  • ISec is a technology-based securities firm in India that offers a wide range of financial services including brokerage, financial product distribution and investment banking for both retail and institutional clients. They have been the largest equity broker in India since FY14 by brokerage revenue and active customers in equities on the NSE.
  • ISec’s FY17 revenue, EBITDA and PAT were Rs. 1,404 cr., Rs. 580 cr. and Rs. 338 cr. resp.
  • ISec is a full service brokerage that offers its retail customers a range of products and services in equities, derivatives and research. Advisory services include financial planning, equity portfolio advisory, alternate investments, retirement planning and estate planning. They also distribute third-party products like mutual funds, insurance, FDs, loans, tax services and pension products.
  • The retail brokerage and distribution business is supported by a nationwide network 200 own branches, 2,600 ICICI Bank branches through which ISec is marketed and over 4,600 sub-brokers, authorized persons, independent financial associates and independent associates.
  • ISec provides domestic and foreign institutional investors with brokerage services, corporate access and equity research. ISec has a large cross-section of institutional clients, including FIIs who are serviced through dedicated sales teams. ISec investment banking business offers equity capital markets and financial advisory services to corporate clients, the govt. and financial sponsors. The equity capital markets services include management of IPO/FPOs, share buybacks, tender offers and equity private placements, domestic and cross-border M&A, private placements, and restructuring.
  • ICICI Direct (ISec’s electronic brokerage platform) currently has 39 lakh operational accounts of which 8 lakh had traded on NSE in the last 12 months. Since inception, they acquired a total of 46 lakh customers through this platform.
  • ISec’s brokerage and commissions business accounted for 89.5% of the total revenue. See Fig 1.

jainmatrix investments, icici securities IPO

Fig 1- ISec FY17 Segment Revenue/ Fig 2 – ISec Segment Revenue Growth

  • ISec was one of the pioneers in the e-brokerage business in India, and started offering online, real-time execution of trades on the NSE and BSE in FY 2000 through ICICI direct, their proprietary electronic brokerage platform. In FY17, over 95% of brokerage transactions by value, and over 90% of MF transactions by number, were performed by customers online.
  • Leaders are Shilpa Kumar MD/CEO, Chanda Kochar Chairperson, Ajay Saraf ED, Harvinder Jaspal CFO

Promoter ICICI Bank – Snapshot and Financials

  • ICICI Bank is the #1 private sector universal bank providing a range of services like commercial & retail banking, project & corporate finance, insurance, VC/PE, IBanking, broking & treasury services.
  • Income and PAT has grown at 11.1% and 1.5% CAGR resp. over 5 years, see Fig 3.
  • There was a weakening in the balance sheets of banks witnessed since FY11-15. During the year 2014-16, ICICI Bank saw asset quality concerns rising and higher NPAs. Some of this was RBI driven, and the policy focus was to clean the books of all banks.
  • ICICI Bank share gained 8.7% CAGR over 5 years and CMP is Rs. 289.6. Dividend yield is around 1%.

jainmatrix investments, icici securities ipo   Fig 3 – ICICI Bank Financials

  • However we are positive that private banks will grow faster at over 20% and gain market share over PSB’s. ICICI bank too is expected to recover rapidly from the 2015-16 asset clean up. Private banks are currently well placed to lead credit growth supported by strong capitalization.
  • From this short note we conclude that ICICI Bank has a fair reputation, and has somewhat rewarded shareholders over the past few years.

News, Business Model and Strategies of ISec

  • ISec’s business strategies are:
    • To strengthen their leadership position in the brokerage business.
    • Continue investing in technology and innovation.
    • Strategically expand their financial product distribution business through cross-selling.
  • Business Model: ISec has a technology based business model which is scalable and asset light. So costs are controlled and cost to income ratio decreased from 84.6% in FY13 to 62.8% in FY17.
  • ISec raised Rs. 1,717 cr. from 58 anchor investors. ISec will allot shares at a price of Rs 520/share to anchor investors, including Temasek, Nomura, Fidelity, Blackrock and Fairfax. IDFC Premier Equity Fund, L&T Mutual Fund Trustee, L&T Prudence Fund Pioneer Investment Fund, Reliance Strategic Investments Ltd and SBI Magnum Balanced Fund were also among the anchor investors.
  • As per ISec, their distribution business is growing at a faster pace than brokerage business. ISec aims to continue leveraging the brokerage customer base for cross-selling. In Mar 2018, ISec commenced robo advisory, which is a goal-based advisory without manual intervention and based on algorithms.
  • In Dec 2017, ISec requested SEBI permission to manage its own IPO.
  • ISec had approached the NCLT in Sep 2017 against the Deccan Chronicle to recover dues. They claimed Rs. 125 cr. dues from DC, as they had indicated their inability to repay the entire amount and offered Rs. 45 cr. of non-convertible debentures. DC partly refunded Rs. 80 cr. but failed to deliver debentures worth Rs 45 cr. Over the last 5 years few banks and financial institutions have been trying to recover loans extended to DC after the publishing house plunged into financial crisis.
  • ISec would be the 3rd subsidiary of ICICI bank which to be listed; ICICI Lombard General Insurance listed in Sep 2017 and ICICI Prudential Life Insurance listed in Sep 2016.
  • ISec aims to increase market share in institutional brokerage business by leveraging their strong position among domestic institutional investors and by increasing their focus on FIIs.

Broking and Distribution Industry Outlook in India

  • The Indian equity brokerage industry, which includes cash equities and equity derivatives brokerage, recorded revenues of Rs. 14,000 cr. in FY17, representing a 20% YoY growth. Industry revenues grew at 14% CAGR between FY12-17 due to rising trading turnover and growing retail participation.
  • Market Share: The top 25 brokers accounted for 51% of trading turnover in the NSE cash equities market in H1 FY18. ISec had a market share of 7.8% in the broking business and 3.5% market share in the distribution business in FY17.
  • The Indian brokerage sector can be classified in terms of type of brokerage service, nature of parent company and business diversification. The following chart sets forth the market structure:

jainmatrix investments, icici securities IPOFig 4 – Indian Broking Industry Structure

  • The equity ADTO (average daily turnover) has increased from Rs. 1,68,400 cr. in FY13 to Rs. 6,21,000 cr. in H1 FY18, a CAGR of 33.6%. Equity derivatives account for a major portion of the volumes, representing 95.1% of the total equity turnover in H1 FY18. Further, the equity ADTO from the equity derivatives segment has grown at a CAGR of 34.5% from FY13 to H1 FY18, as compared to a CAGR of 20.6% in the cash equities segment, primarily on account of higher index levels, reduced STT on equity futures from 0.017% to 0.01% and an increasing share of high frequency and algorithmic trading, especially in the derivatives market.
  • As per CRISIL Research estimates, the Indian equity brokerage industry revenues are projected to increase at 15-18% CAGR in the next 5 years and reach Rs. 30,000 cr. by FY22, driven mainly by the continued uptick in trading volumes and increasing retail investor participation. (Source: ISec RHP)
  • As per AMFI, the commissions paid by MFs to distributors grew from Rs. 2,400 cr. in FY13 to Rs. 5,000 cr. in FY17, a CAGR of 20.1%. Increased financial savings, superior returns from MFs, greater reliance on distributors and govt. policies acted as key catalysts in driving the distribution revenue growth. In addition, as per a SEBI directive in Sep 2012, AMCs were permitted to pay higher commissions to distributors in B15 cities to increased investments from under-penetrated regions.
  • According to CRISIL Research, the AUM of AMCs is projected to grow at a CAGR of 21% from FY17 to reach Rs. 44 lakh cr. in FY22. Improvement in economic growth, low MF penetration, higher disposable income coupled with increased financial savings, rising retail participation, expanding geographic reach, higher digitisation and supportive govt. policies focusing on increasing awareness and ease of investing are expected to be the growth catalysts. (Source: ISec RHP).
  • There was a growth in number of demat accounts (30% CAGR FY13- H1FY18).

Financials of ISec

  • ISec’s revenues, EBITDA and PAT grew at 18.7%, 35.8% and 47.3% CAGR in 5 years, see Fig 5.
  • The 9M FY18 financials look excellent. The 9M FY18 PAT is 17.6% higher than the entire FY17 PAT.

jainmatrix investments, icici securities IPOFig 5 – Financials

  • The margins are high and have improved sharply over 5 years of FY12-17. PAT margin has risen from 10.1% (FY13) to 24.1% (FY17), and to 29.6% in 9M FY18. This is a positive.

jainmatrix investments, icici securities IPOFig 6 – ISec Cash Flow

  • ISec has been Operational Cash flow positive in the last 5 years FY13-FY17. This is a positive. In 9M FY18, this CFO is slightly negative; however the trend was the same for 9M FY17 after which for the full year CFO was large and positive. See Fig 6.
  • FCFE here is Free Cash Flow to Equity, which is the sum of CFO, Capex and Net Borrowings.
  • ISec had a RoE of 77.5% in FY17 while the 3 year average RoE stood at 76.9% (FY15-17). The RoCE stands at 90.8%. These return ratios are high and excellent.
  • The current D/E ratio is 1.27:1 which is moderate. The debt completely pertains to short term debt where money has been raised using commercial paper repayable within one year.
  • The dividend payout ratio has improved from 41.8% to 60.5% (FY13-17). This is a positive.
  • ISec’s business is asset light and requires minimum CAPEX and hence the company has throughout generated positive FCFE and a high return on equity. The trend is likely to be the same going ahead.

Benchmarking

We benchmark ISec against other listed companies providing similar services. See Exhibit 7.

jainmatrix investments, icici securities IPOExhibit 7 – Benchmarking

Note 1 – While these firms are the closest peers, ISec is mostly a stock broker. EFS, IIFL and JMF have substantial NBFC activities. EFS, IIFL and MOFS are also asset managers with PMS and MF activities. Note 2 – ISec P/B has been calculated basis Book Value as on 9M FY18. For other companies P/B has been calculated basis closing price as on 22.03.18. 

  • The PE post IPO is high/expensive, so pricing appears aggressive, this is a negative. On the P/B front as well, ISec is expensive. The 3 year sales growth of ISec is the lowest in the industry, however the 3 year PAT growth is excellent due to improving margins and cost controls.
  • The RoE at 77.5% is massive and excellent, the best in the industry. This is a positive. The RoE is likely to remain high in the future as well due to the nature of their business.
  • ISec had the lowest EBITDA margin, however the highest PAT margin in the industry indicating a great cost control and efficiencies in operations. The dividend yield at 1.22% is the highest.
  • We can understand that ISec is a pure stock broker, and has group companies handling other asset management and NBFC activities. It thus has good focus on this business. It is able to keep operating costs low. With this, it is able to provide high profit margins and leading returns and is a high dividend firm. Thus we feel that the high valuations are justified.

Positives for ISec and the IPO

  • ISec is powered by a solid proprietary technology platform called ICICI Direct. It is backed by robust infrastructure and has processed at peak over 19 lakh orders and trades in a day.
  • ISec has a strong and growing distribution business with an “open-source” model.
  • ISec is a beneficiary of a transformation in the Indian savings environment, of household savings shifting from physical to financial assets. The share of financial savings as a proportion of household savings has increased from 31.1% (FY12) to 41.5% (FY16). The share is likely to rise further, as physical savings such as gold and real estate are providing lower investment returns.
  • ISec is a strategic component of the icici ecosystem and have mutually beneficial agreements with companies in the Group. The customers of ICICI Bank are allowed to trade in equity securities using a“3-in-1 account” facility with seamless integration providing great convenience.
  • Strong financial performance with significant operating efficiency.
  • As a full service stock broker, ISec provides ‘good enough’ services for new and small investors.
  • ISec has a good brand thanks to ICICI Bank, so visibility for this IPO is not an issue.

Risks and Negatives for ISec and the IPO

  • The valuations appear on the higher side among peers as P/E is 34.6 times.
  • Stock broking industry is cyclical. It does very well in positive investment climates. However if there is a slowdown, a global trade war or adverse economic situation, and investors turn defensive, brokerage revenues can dry up rapidly and return ratios can turn negative. The RHP financial data of ISec is for a 5 year period and does not reveal the financial effects of a negative climate on ISec.
  • The entry and success of discount brokers like Zerodha, 5Paisa and RKSV is already attracting away HNI and advanced trading customers with low costs, better user experiences, etc. We do feel that so as to not lose customers ISec may be soon forced to add a discount broking platform.
  • The brokerage industry is highly competitive and fragmented with close to 500 brokers in operation. Many of ISec’s peers added businesses like financial services, loans and asset management as brokerage rates got squeezed over the last 10 years from 2-4% to a maximum of 0.75% today (on cash delivery). Consolidation is happening. However as a top 5 player, ISec can hope to benefit from consolidation.
  • ISec is subject to extensive statutory and regulatory requirements and supervision from SEBI, and any adverse policy changes or punitive action in future can have material influence on ISec.
  • ISec relies heavily on its relationship with ICICI Bank for many aspects of their business. Any changes in this relationship, or even a policy change that (hypothetically) forces ICICI Bank to allow customers to have “3-in-1” accounts with other stock brokers, can affect ISec business.
  • The stock broking industry has an image problem with many issues:
    • Pushy sales persons often force new accounts on unsuspecting prospects, which then remain inactive. The RHP itself reveals 31L of 39L accounts of ISec inactive on NSE over last 12 months.
    • Aggressive wealth managers and “advisers” call customers and “churn” their portfolio ever so often.
    • ‘Higher brokerage revenues’ and ‘growing the wealth of customers’ are inherently clashing objectives for stock brokers, which customers may not understand until too late.
    • Managing of equity portfolios of value below Rs 25 lakhs is a common (grey area) activity by stock broking employees and affiliates with uneven results for customers.
    • Stock broking equity research reports target 10-15% gains from stocks (and quick exits) while simultaneous reports from RIAs or Research Analysts on the same stocks may target 100-150% gains (over 1-3 years), which may have better wealth outcomes.
  • We feel ISec has a fuddy duddy image and may need to undergo UI and design transformation changes to appeal to millennials.
  • The Indian broking industry has a long way to go in terms of customer friendly initiatives such as tracking and shadowing of professional portfolios, providing trading access to professionals, portability of trading accounts and investments, etc.

Overall Opinion and Recommendation

  • The Indian equity markets are growing deeper and wider year after year.
  • The shift towards financial assets over physical assets has grown brokerage and financial products distribution businesses, supported by demonetization, improved financial markets awareness, financial inclusion and ramp up in digital infrastructure. The retail participation is nowhere near the peak and likely to grow even stronger in the years to come.
  • ISec has a good brand, a top 5 market position, good synergy with ICICI Bank, a nationwide infra for supporting and growing its customer base and an excellent last 5 years and 9M FY18 financial performance where it has emerged as one of the leaders.
  • At a P/E of 34.6 times, the valuations of the IPO appear to be high. However earnings growth is likely to continue at a high rate. Superior RoE, high and improving margins, scalable business model, and sectoral tailwinds make this issue attractive.
  • Key risks are 1) Cyclical industry 2) High and rising competition 3) No discount brokerage offering from ISec 4) Poor image
  • Opinion: Investors can SUBSCRIBE to this IPO with a 2 year perspective.

Disclaimer and Disclosure

This document has been prepared by JainMatrix Investments Bangalore (JM), and is meant for use by the recipient only as information and is not for circulation. This document is not to be reported or copied or made available to others without prior permission of JM. It should not be considered or taken as an offer to sell or a solicitation to buy or sell any security. The information contained in this report has been obtained from sources that are considered to be reliable. However, JM has not independently verified the accuracy or completeness of the same. Punit Jain has been a customer of ISec and ICICI Bank since over 10 years. JM has no stake, ownership or any other known financial interests in ISec or any group company. Neither JM nor any of its affiliates, its directors or its employees accepts any responsibility of whatsoever nature for the information, statements and opinion given, made available or expressed herein or for any omission therein. Recipients of this report should be aware that past performance is not necessarily a guide to future performance and value of investments can go down as well. The suitability or otherwise of any investments will depend upon the recipient’s particular circumstances and, in case of doubt, advice should be sought from an Investment Advisor. Punit Jain is a registered Research Analyst under SEBI (Research Analysts) Regulations, 2014. JM has been publishing equity research reports since Nov 2012. Any questions should be directed to the director of JainMatrix Investments at punit.jain@jainmatrix.com.

Bandhan Bank IPO – The New MFI Leader

  • Date 14th Mar; IPO Opens 15-19th Mar at Rs. 370-375
  • Large Cap: Rs. 44,780 cr. Mkt cap
  • Industry – Commercial Bank
  • Valuations: P/E 40.2 times TTM, P/B 4.9 times (Post IPO)
  • Advice: SUBSCRIBE 
  • Overview: Bandhan is a commercial bank focused on serving underbanked and underpenetrated markets in India. Bandhan Bank has the largest microfinance loan portfolio, with Rs. 21,380 crores as of FY17. Bandhan bank has a great brand recall, strong financial performance, good asset quality and an experienced management. It is the new MFI loans leader. Presence in underbanked East and NE regions and universal bank structure are key strengths. At a P/B of 4.93 times (post IPO), the valuation look expensive. However Bandhan has a focus and a leadership position. It also operates in niche geographies.
  • Risks: 1) Economically and politically sensitive sector 2) Significant exposure to unsecured loans.
  • Opinion: Investors can SUBSCRIBE to this IPO with a 2 year perspective.

Related Reports:

Here is a note on Bandhan Bank (Bandhan) IPO.

IPO highlights

  • The IPO opens: 15-19th Mar 2018 with the Price band: Rs. 370-375 per share.
  • Shares offered to public number 11.92 cr. The FV of each is Rs. 10 and market Lot is 40.
  • The IPO in total will collect Rs 4,473 cr. while selling 10% of equity.
  • The promoter & promoter group owns 89.6% in Bandhan which will fall to 82.2% post-IPO.
  • The offer will be both a sale by current shareholders (OFS) and also by issuing fresh shares. The OFS proceeds would be Rs. 810 cr. at UMP and fresh issue size is Rs. 3,662 cr.
  • The selling shareholders are IFC and IFC Investment Co. They are partly exiting through this IPO. The IPO is being launched as Bandhan needs to comply with the RBI’s direction of listing publicly and reducing promoter holding to 40% within the first 3 years of operations.

jainmatrix investments, bandhan bank ipo

Exhibit 1 – IPO Selling Shareholders

  • The IPO share quotas for QIB, NIB and retail are in ratio of 50:15:35.
  • The unofficial/ grey market premium for this IPO is Rs. 30-35/share. This is a positive.

Introduction

  • Bandhan is a commercial bank focused on serving underbanked and underpenetrated markets in India. They have a universal banking license that permits them to provide banking services pan-India across customer segments. They currently offer a variety of asset and liability services designed for microfinance (MFI) and general banking, as well as services to generate non-interest income.
  • Revenues, NII and profit for FY17 were Rs. 4,320 cr., Rs. 2,403 cr. and Rs. 1112 cr. resp. It has 27,176 employees. 88% of their gross loans were micro loans (FY17). 96% of their loan book is unsecured.

jainmatrix investments, bandhan bank ipo

Fig 2a – Loan products

jainmatrix investments, bandhan bank ipo

Fig 2b Gross Loans and Fig 2c Loans Segments

jainmatrix investments, bandhan bank ipo

Fig 3a Regions and Fig 3b Segments FY17

  • Bandhan Konnagar was formed in 2001 as a NGO providing microfinance services to socially and economically disadvantaged women in rural West Bengal. It later became Bandhan Financial Services Ltd and subsequently got the conditional banking license in 2014.
  • Bandhan operated across 33 States and UT’s through 887 branches, 2,633 doorstep service centres and 430 ATM’s. The gross loans of Bandhan are displayed in Fig 2b and 2c. 58% and 23% of the loans were from East and NE regions resp. for 9M FY18. Hence there is a geographic concentration risk.
  • Bandhan generates 87% of revenues from retail banking business. See Fig 3(b).
  • Total borrowings were Rs 1,330 cr. (9M FY18) and the cost of borrowings was 7.9% (FY17).
  • Leadership is Chandra Shekhar Ghosh (MD & CEO), Sunil Samdani (CFO) and Biswajit Das (CRO).

News, Updates and Strategies of Bandhan

  • IFC had invested in Bandhan Feb 2016 at Rs 42.93 so for their partial exit they will get 7.7X returns.
  • The bank’s loan book grew at 51% CAGR over past 17 years, which slowed to a still strong 33% by 9M FY18. As per mgmt., in next 2-3 years a 33-35% growth in advances can be achieved.
  • RBI’s guideline is to reduce the promoter’s stake to 40% within 3 years from the date of start of business as a bank. Bandhan received the nod in June 2015, so this timeline is quite close.
  • Bandhan’s business strategy is as follows:
  • To maintain focus on micro lending while expanding further into other retail and SME lending.
  • To strengthen their liability franchise in order to provide a stable, low-cost source of funding.
  • To enhance their digital platform to improve customer acquisition and retention and reduce costs.

Micro Finance and Banking Industry Outlook in India

  • Financing needs in India have risen along with economic growth over the past decade. By complementing banks and other financial institutions, NBFCs help meet this need.
  • MFI is a volatile sector that can be badly affected by economic and political events. The Bank structure is better to house MFI activities, as can be seen by Bharat Financial merger with IndusInd Bank, and SFB license to several players by RBI. Bandhan has a good advantage here.
  • Bandhan has the largest overall gross micro-banking asset portfolio, with Rs. 21,380 cr. as of FY17. Amongst the banks (private as well as public), the micro loans given by Bandhan are more than 3 times the next player, SBI.
  •  It has an estimated 15-20% share in MFI.
  • Penetration of Microfinance is low in NorthEast India, which can be to Bandhan’s benefit. See Fig 4.

jainmatrix investments, bandhan bank IPO

Fig 4 – Micro Finance Penetration (Source: The Bharat Microfinance Report 2017)

  • The gross loan portfolio (GLP) of MFIs grew at 51% CAGR from FY13 to FY17. This growth was fuelled largely by the growth in GLP of some large players, such as Janalakshmi Micro-finance, Bharat Financial Inclusion, Ujjivan Financial Services and Satin Creditcare Network.
  • Banking credit growth slumped in the previous 2 fiscal years owing to asset quality and capital adequacy issues. However, as per CRISIL Research bank credit will rise owing to improvements in working capital demand, marginal pick-up in private investment, increased govt. spending on the infra, improvements in commodity prices, and expectations of a good monsoon season.
  • Though demonetisation affected the retail sector’s credit performance in FY17, which dropped 300 bps from FY16, growth remained higher than industrial and agricultural credit growth in FY17. The retail segment represents more than one-fifth (23% as of FY17) of overall banking credit, and in turn, derives a major share from housing finance, which accounts for 53% of retail credit by banks as of FY17. So the retail segment was negatively impacted by the demonetisation-driven slump in the real estate sector. Retail credit grew 16% YoY, while industrial credit contracted YoY by 2%.

Financials of Bandhan Bank

  • Bandhan’s revenues, NII and PAT over the years are in Fig 5.
  • Previous data is not shared as its business model changed from an NGO to NBFC to a bank.
  • Bandhan had a RoE of 25.01% and RoA of 4.5% in FY17. This is excellent as the return ratios are high and amongst the best in the industry. It has not declared any dividends in the last 5 years.

jainmatrix investments, bandhan bank

Fig 5 – Financials (FY18 is projected by extrapolating 9M results)

  • NIM’s for Bandhan have declined in the last few years, however the NIM’s were high at over 11% in FY16 which has gradually declined to 9.86% in 9M FY18. Currently, it earns a high yield on loans, however as the bank expands its loan portfolio to other segments and into general banking there could be significant drop in the NIM.
  • The gross loan and disbursement growth slowed in FY17 due to demonetization related issues.
  • Bandhan has a robust asset quality. The GNPA as on 9M FY18 stood at 1.67% whereas the NNPA’s stood at 0.8%. The NNPA’s for FY17 were as low as 0.4%. Priority Sector Loans constitute 31.6% of the total advances as of 9M FY18. 97.6% of the GNPA’s are from the PSL loans for Bandhan Bank.
  • As a universal bank, Bandhan has a CASA ratio of 33.22%. This is fair, and should grow in future.

Benchmarking

We benchmark Bandhan against peers, See Exhibit 6.

jainmatrix investments, bandhan bank ipo

Fig 6 – Benchmarking

  • Majority of the peers have reported losses in 2 of last 4 quarters. Prices have however kept up well.
  • PE of Bandhan is the lowest in the peer group. However it is low because the peer group companies have depressed earnings reported in the last 4 quarters.
  • In terms of PB, the valuations are in the mid-range at 4.93 times post IPO. The valuation looks expensive considering that 96% of Bandhan’s loan book is unsecured and they would be entering new categories which have lower margins.
  • The D/E ratio at 0.15 (diluted post IPO) is the best and lowest and hence gives Bandhan scope to aggressively lend. The CAR of Bandhan stood at 26.4% for FY17 as against RBI’s minimum requirement of 15%, which indicates that it is adequately capitalized.
  • The RoE is the highest at 25.01% and Bandhan has the lowest GNPA’s (9M FY18) amongst its peers. This is a positive. Bandhan also has the lowest cost to income ratio of 36.3%.

Positives for Bandhan bank and the IPO

  • As a universal bank, Bandhan has flexibility to operate across multiple product lines and with few restrictions. It is the leader in the MFI industry as other players are Small Finance Banks or NBFCs.
  • World Bank arm International Finance Corporation (IFC) is an investor/ promoter of Bandhan.
  • Bandhan has a strong presence in East & NE India, which are more agriculture and agro-commodity intensive regions. We feel it may have high scope to grow and penetrate deeper here.
  • Bandhan’s growth has been achieved despite difficult conditions in India’s MFI and banking industry. Events like the crisis in the southern state of AP in 2010, demonetisation in late 2016 and farm loan waivers, were challenges for the banking industry. But Bandhan did well.
  • In MFI, achieving volumes of loans is a powerful advantage as the costs of reach and distribution are shared across many loans. With a good marketshare and presence in East & NE, it has an advantage.
  • Bandhan has a large low cost distribution network. They operate in 33 States and UTs in India, reaching 1.2 crore customers. Bandhan’s distribution network is relatively low cost because of its ‘hub and spoke’ model of using DSCs and associate bank branches, and focus on tech initiatives, which reflects in their operating cost-to-income ratio of 35.4% & 36.3% for 9M FY18 & FY17, resp.
  • The asset quality of Bandhan is stable with NNPA’s at 0.80% for 9M FY18. Financially the firm is well managed with excellent return ratios, good margins and tight controls on costs. This is a positive.
  • Bandhan has a good management team. The founder, MD & CEO, Mr. Chandra Shekhar Ghosh, has 37 years of experience in Indian MFI. Members of their senior management have a track record that combines professional and entrepreneurial skills in microfinance and banking, with average 23.9 years of experience in finserv. 8 of 12 directors on the board are Independent Directors.

Risks and Negatives for Bandhan and the IPO

  • The valuations are on the higher side in terms of P/B at 4.93 times (adjusted post IPO).
  • Bandhan has a limited financial history and a rapidly evolving business which makes it difficult to evaluate their business and future operating results.
  • Bandhan’s micro finance loan portfolio is not supported by any collateral that could help ensure repayment of the loan, and in the event of non-payment by a borrower of one of these loans, they may be unable to collect the unpaid balance.
  • Bandhan handles cash in a high volume of transactions occurring through a dispersed network of branches and DSCs; as a result, they are exposed to operational risks, including fraud, petty theft and embezzlement, which could harm financial position.
  • Bandhan’s business relies significantly on their operations in the East and NE states, and any adverse changes in the conditions affecting these States can adversely impact their business. As of FY17, roughly 81% of Gross loans were located in such areas.
  • The microfinance sector is sensitive to economic, political and weather events

Overall Opinion and Recommendation

  • Microfinance sector carries out the critical role of financial services penetration into rural India. MFI’s have been operationally under stress since 2017 due to demonetization and GST rollout. The earnings were impacted due to a spike in defaults and business disruption. However the current signs are that this impact is over and the rural economy & demand is regaining strength.
  • Bandhan bank has a great brand recall, strong financial performance, good asset quality and an experienced management. It is the new MFI loans leader.
  • Presence in underbanked East and NE regions and universal bank structure are key strengths.
  • At a P/B of 4.93 times (post IPO), the valuation look expensive. However Bandhan has a focus and a leadership position. It also operates in niche geographies.
  • Opinion: Investors can SUBSCRIBE to this IPO with a 2 year perspective.

Disclaimer

This document has been prepared by JainMatrix Investments Bangalore (JM), and is meant for use by the recipient only as information and is not for circulation. This document is not to be reported or copied or made available to others without prior permission of JM. It should not be considered or taken as an offer to sell or a solicitation to buy or sell any security. The information contained in this report has been obtained from sources that are considered to be reliable. However, JM has not independently verified the accuracy or completeness of the same. JM has no stake ownership or known financial interests in Bandhan or any group company. Punit Jain intends to apply for this IPO in the Retail category. Neither JM nor any of its affiliates, its directors or its employees accepts any responsibility of whatsoever nature for the information, statements and opinion given, made available or expressed herein or for any omission therein. Recipients of this report should be aware that past performance is not necessarily a guide to future performance and value of investments can go down as well. The suitability or otherwise of any investments will depend upon the recipient’s particular circumstances and, in case of doubt, advice should be sought from an Investment Advisor. Punit Jain is a registered Research Analyst under SEBI (Research Analysts) Regulations, 2014. JM has been publishing equity research reports since Nov 2012. Any questions should be directed to the director of JainMatrix Investments at punit.jain@jainmatrix.com.