Indian IT Services Sector – Add the Digitals

JainMatrix Investments presents an Industry report on the Indian IT Services sector. It’s a sector that is growing at 8-10% annually and has significant share in global outsourcing. An ecosystem of good college education and a large pool of talent, feed a clutch of globally competitive Indian IT Service firms. The digital demand has only grown post-covid, so the industry is looking at many years of global growth in early double digits. See the Conclusion section for our recommended IT Services portfolio.

We make our 11th Jan 2021 IT Services sector report public for your investing pleasure and success.

jainmatrix investments, IT Services

Additional sector reports:  Happiest Minds IPO – Ride the Digital Wave – Sept 2020    

                                               LT Tech Services IPO – The Make in India Firm – Sept 2016

Introduction and Profile

  • Indian IT services industry started over 30 years ago, but is now very large with revenues US$ 191 billion (INR 14 lakh crores). About 81% of revenues are from exports. See Fig 1a.
  • It has 17,000 firms & is an emerging global hub for Digital Skills, with 75% of global digital resources.
  • IT Services have contributed 7.7% to the India GDP in 2019 which is expected to grow to 10% by 2025 (IBEF). In FY19, the industry employed 41 lakh people. It is also fueling innovation, as there are around 5,300 tech start-ups in India.
  • Exports rose at a CAGR of 8.05% during FY16-19. Export of IT services has been the major contributor, accounting for 54% of total IT export (including hardware) during FY19.
  • Globally, the sector is headed towards achieving USD 1 trillion (INR 75 lakh crores) of revenues by 2022.

Fig 1a – Market Size in India and Fig 1b – Share of Demand by Country

  • USA dominates global Country Share of demand, with EU, China and Japan coming next, see Fig 1b.
  • In Fig 1b, market share of Indian IT industry looks small but this is domestic demand in USD. India is a dominant supplier of IT services globally and has the fastest growing industry in the world with most key players having a HQ or development centers here.
  • BFSI is a key business vertical for IT & BPM industry, in terms of major revenue-share. Adoption of new technologies is needed for growth & competitive advantage in Banking & Insurance domain.
  • Other important sectors are Life Sciences & Healthcare, Retail & CPG, Communications & Media, Manufacturing, Telecom and Technology & Services.
  • Indian IT industry’s USP is cost competitiveness, good skills, resource availability and project management skills for providing IT services.  
  • Tier II and III cities are gaining traction among IT firms aiming to grow business in India, facilitated by skilled local resources, affordable real estate, favorable Govt. regulations, tax breaks and SEZ schemes. A hub and spoke model is developing with Tier I city as hubs and tier II, III and IV as spokes.
  • India is a top location for Global Capability Centers (GCCs), which concentrate on workers and infra to handle operations (back-office, corporate business-support, accounting & finance, transaction processing and contact centers) and IT support (app. development and maintenance, remote IT infra, and help desks), to enhance productivity. Some large companies use GCCs as a center of excellence for innovation and research.
  • About 70% of India-based GCCs belong to US companies, 20% European and 10% Asia-Pacific.
  • According to Nexdigm, India is home to over 1,750 GCCs, which is 50% of all such centers globally. GCCs here employ over 10L employees, generating a total economic value of around $28.3 billion.
  • IT Services in India are growing at a fast pace due to the globally competitive firms that provide world-class services. The Human talent pool available in India is highly skilled and trainable, a key strength of the IT Services sector. The IT infra here has also developed to global standards.

IT Sector Progress and News

  • NASSCOM (National Assn. of Software & Services Cos.) launched an online platform to up-skill 40 lakh tech professionals. It partnered with GE Healthcare for digital healthcare solutions for the market.
  • IT service firm DXC Technology, will set up its first global analytics unit in Bengaluru.
  • Govt. of India (GoI) announced a national program on AI (artificial intelligence) and a new National AI portal. GoI has identified IT as one of 12 champion service sectors for developing an action plan. It has set up a ₹5,000 crore ($ 745 m) fund for realizing the potential of these champion service sectors.
  • As of Feb’20, there were 421 approved SEZs (Special Economic Zone) across the country, and of these, 276 are from IT & ITeS. These provide tax incentives for exports. Software Technology Parks of India (STPI) has set up 57 centers for single window clearance and infra facilities, and for Excise Duty exemptions on buying local goods.
  • Technology for many businesses was considered a support function. This has changed as tech. has become business critical, enabling employee productivity, revenue growth from eCommerce, cost savings and faster customer support & communication.
  • TCS took the #1 spot with M-cap of $144 b among IT Services organizations, dethroning Accenture which is trailing by just $1b (Dec ‘20).

Impact of Covid

  • In Q1FY21, Indian IT sector has emerged as a winner post lockdown. With Work from Home (WFH) at 95%, all the big IT firms saw robust demand from clients, particularly cloud & automation. Infosys gained in revenue and profits; IT index gained 22% in July. Similarly in Q2FY21, IT sector gained due to increased tech spending by clients in digital transformation.
  • Due to automation, spending on IT infra has outpaced HR. Job creation has been limited with offers being rolled out more on contractual basis than full-time, in both emerging & developed markets.
  • Many firms found that WFH employees are equally productive & this saves real estate costs as well. It also relieves firms of covid related responsibility and litigation.
  • IT Deals – Indian IT stocks jumped by 50%, on an average, between Mar-Sept ’20. Top IT firms have been closing deals – Infosys closed 2 big deals, Vanguard and Consolidated Edison (digital transformation); TCS won deals from Phoenix Group (life insurance and pension) for client analytics tool, and Morrisons (retail); Wipro from Marelli (auto software engg.) and HCL Tech from Ericsson.
  • Broker comments: Girish Pai of Nirmal Bang said that global clients shifted spending from internal IT, selling, general and administrative (SG&A) and hardware, to outsourcing and digital, to speed up the digital transformation processes such as migration to cloud.
  • Motilal Oswal, a brokerage firm, said that demand & utilization has normalized to pre-Covid levels with discussions being revived for deferred deals and margins expected to be resilient as well.

Relative Price Performance

  • The graph in Fig 2 – Relative Share shows the stock returns given by listed Indian IT Services firms over Oct’18 – Jan’21.
  • We can see that performance was steady for these firms till early 2020 in a +25 to -10% ranges, then there was a sharp fall due to Covid. Recovery came by July’20 and in next 6 months there was a dramatic price rise for many of them.
  • On the right side we can see the resultant share performance by order for the 2+ years.
  • Among large caps, L&T Infotech is #1, marked L1, Infosys #2, HCL Tech #3 and next are Wipro #4, TCS #5 and Tech Mahindra #6. Among mid-caps, the rankings are Persistent is #1, marked M1, others are Mindtree #2, Mphasis #3, LTTS #4 and Sonata Software #M5.
  • Even so, the entire IT Services pack has performed very well as even the lowest performance was 42% gains over 2+ years, while the highest is an amazing 179% gain.

Fig. 2 – Relative Share Price

Large Cap Firms – Benchmarking and Sales Charts

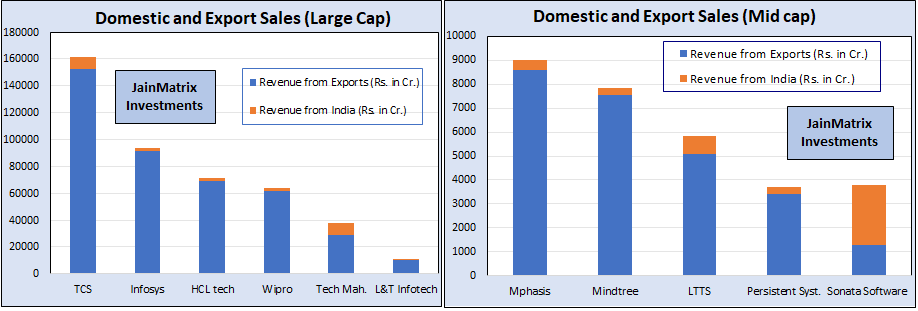
Fig 3a – LC revenue and Fig 3b – MidCap

In Fig 3a we map the FY20 revenues for Large Cap Firms. Revenue from exports is the major source.

  • TCS has the highest sales by value, almost two-fold to the nearest competitor Infosys.
  • In terms of India revenues, Tech Mahindra has the highest domestic sales followed by TCS.

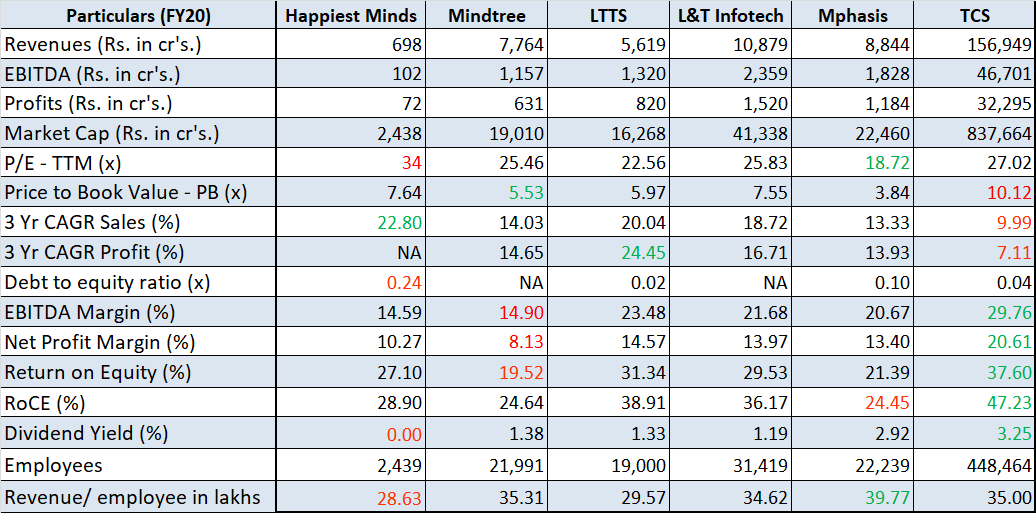
Fig 4a – LC Benchmarking

  • In Fig. 4a – Benchmarking, we compare large cap IT services firms on key financial parameters.
  • The leader is marked in green and the laggard in red. The sum total of these parameters is the Score.
  • We can see that TCS is a clear leader, including RoCE and Return of Equity, while Wipro lags on this comparison amongst 6 large cap firms. L&TI however appears as a growth and profit leader.

Mid-Cap Firms – Benchmarking and Sales Charts

  • In a similar manner, we compare mid cap IT services firms. In Mid-cap basket, Sonata is the leader on financial parameters, including RoCE and RoE, whereas Persistent lags among the 5 firms.

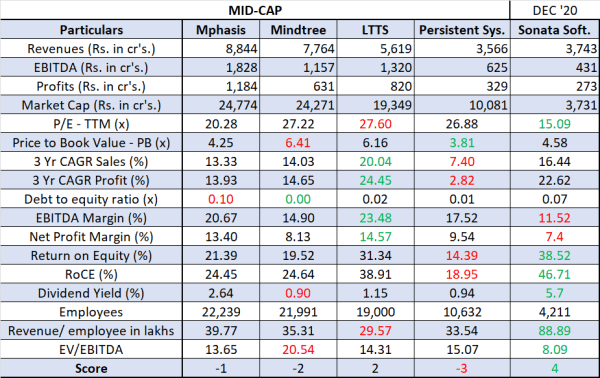
Fig. 4b – Mid-caps Benchmarking

  • Among mid-caps, Mphasis has the highest revenues or sales, followed by Mindtree.
  • Sonata Software has the highest domestic sales by value and proportions.
  • Fig 4b above captures the MidCap firms revenue by domestic and exports.

Future of the Indian IT Services Industry

  • The comparative advantages of the country are – young population, good college education and ample science and technical courses. These feed this sector with quality resources.
  • India is developing as a critical part of execution and delivery of global business and IT Services, across industries & locations. Firms like TCS are covering more countries & expanding the market.
  • The growth of Telecom networks like 2G-4G and now 5G are bringing the world closer.
  • Covid has actually accelerated the rise of digital, eCommerce, internet and the IT Services industry. As larger firms enforced WFH for their employees’ safety, the physical presence has become unnecessary for work, for large swathes of industry. 
  • TCS as the #1 firm globally in terms of market capitalization has been able to sustainably mix high margins, high growth and a global vision. The other firms in the industry are growing in its wake and developing their own niches and strengths.
  • The industry is looking at many years of global growth in early double digits, even as IT services take early baby steps of growth in its own backyard, India. With programs like Aadhar card, UPI payments, GST, digital tax filing and FASTag, technology is proving the best way to transact at scale with speed and transparency, and also reduce corruption.
  • The success of the Indian IT Services firms has spawned the second generation of services firms such as Syngene Intl. (pharma R&D) and Tata Elxsi & LTTS (Engineering R&D) which are niche services players by technology or industry.
  • The key new IT services trends are WFH, cloud services, AI, IoT, robotics, mobile apps and machine learning.

Conclusion:

  • IT Services firms are always going to be needed to stitch together solutions for large Enterprises, and to help them navigate, evaluate and deploy in complex IT landscapes with multiple technology options.
  • Indian IT services companies have time and again proven their mettle and have the skilled resources and project management skills to deliver successfully. It is a dynamic, globally focused sector.
  • The 11 firms had an excellent share price performance range of 42% to 179% gains over 2+ years.
  • The weak INR may help India to continue to be a good base for service delivery teams and exports.
  • Large Caps: A LC IT Services portfolio will be more stable and safer for investors. We conclude from Fig 2, Fig 3a, and Fig 4a that of the 6 LC firms, the best 3 are L&T Infotech, TCS and Infosys.
  • Mid-Caps: A MidCap IT Services portfolio will be more volatile, but possibly provide better returns. We can see from Fig 2, Fig 3b and Fig 4b that of the 5 LC firms, the best 2 are Mindtree and LTTS.  
  • We recommend investors to buy this 5 firm portfolio in an equi-weight mode.

Disclaimer

This document has been prepared by JainMatrix Investments Bangalore (JM), and is meant for use by the recipient only as information and is not for circulation. This document is not to be reported or copied or made available to others without prior permission of JM. It should not be considered or taken as an offer to sell or a solicitation to buy or sell any security. The information contained in this report has been obtained from sources that are considered to be reliable. However, JM has not independently verified the accuracy or completeness of the same. Punit Jain has equity holdings in LTTS, Sonata Software, TCS and L&T Infotech, all <1%. Punit Jain has worked at TCS (1995-2002) and in Sonata Software (2003-2012). Other than this, JM has no known financial interests in any of these firms. Neither JM nor any of its affiliates, its directors or its employees accepts any responsibility of whatsoever nature for the information, statements and opinion given, made available or expressed herein or for any omission therein. Recipients of this report should be aware that past performance is not necessarily a guide to future performance and value of investments can go down as well. The suitability or otherwise of any investments will depend upon the recipient’s particular circumstances and, in case of doubt, advice should be sought from an Investment Advisor. Punit Jain is a registered Research Analyst under SEBI (Research Analysts) Regulations, 2014. JM has been publishing equity research reports since Nov 2012. Any questions should be directed to the director of JM at punit.jain@jainmatrix.com.

Indian Automobile Sector – A Solid Portfolio

Here is an Industry report on the Indian Automobile sector. It’s a sector that suffered weak sales post covid, but has recovered quite sharply in the last few months. The growing confidence and global growth plans of Indian auto firms can see the rise of many Indian auto MNCs in the next few decades. We recommend investors buy an Auto portfolio of Escorts Ltd., Eicher Motors, Bajaj Auto, Hero Motocorp, and Maruti Suzuki.

We make our Dec2020 Auto sector report public for your investing pleasure and success.

Additional sector reports:   Eicher Motors – It’s Firing On Both Engines

Hero Motocorp – A Splendid Core Holding

jainmatrix investments, auto sector report

Introduction

  • The automobile industry of India is in the top 5 markets in the world. It is one of the driving forces of the Indian economy, contributing 49% to the mfg. GDP and 7.5% to overall GDP. The sector’s value chain employs about 3.2 crore people, directly or indirectly.
  • The auto sector can be divided into four sub-segments: Passenger cars, Two- Wheelers, Tractors and Commercial Vehicles (PC, 2W, TT and CV). The segment shares by volume is depicted in Fig. 1
Fig. 1 – Auto Sector Volumes Share
  • 2W and PC dominate the domestic Indian auto market. Passenger car sales are dominated by small and mid-sized cars. 2W and PCs together had a combined sale of over 2.01 crore vehicles in FY20.

Sector Market Shares

  • The brand which dominates in the 2W segment is Hero MotoCorp having 36% market share, as depicted by Fig. 2a. In the case of TT, it is (M&M) Mahindra and Mahindra (41.17%), see Fig 2b.

Fig 2a and 2b – Market share by firms – 2W and Tractors; Fig 2c and 2d – PC and CVs

  • In the PC Vehicles, it is Maruti Suzuki (51.30%), Fig 2c, and in case of CVs, it is M&M with a market share of 35.04%, Fig. 2d.
  • Electric Vehicles – In the year 2020 the electric vehicle market in India took off. The Auto Expo 2020 in Feb saw the introduction of many EVs of different sizes and prices from the automakers. The models that were soon commercially launched were Tata Nexon EV, Morris Garages ZS EV and Mahindra eVerito. M&M also launched the Mahindra eKUV100 at the Auto Expo 2020 and has priced the car from ₹8.25 lakhs making it the most affordable electric car in India.
  • The shift of industry towards electric vehicles has brought uncertainty in the sector. Govt. goal of 100% electrification in auto industry has open doors for the new products in India.
  • However, electrification is the initial phase in India. EVs may find it difficult to grow significant share without 1) Tax benefits from GoI 2) an EV make, charge and repair ecosystem 3) the entry of luxury EV products from Tesla, JLR (Tata Motor) and Audi, that can make the products attractive. 

Auto Industry Updates

  • Auto exports reached 47.7 lakh vehicles in FY20, growing at a CAGR of 6.94 % during FY16-FY20. 2W were 73.9% of vehicles exported, PCs were 14.2%, three wheelers at 10.5% and CVs at 1.3 %.
  • In Nov’20, FM announced the ₹2 lakh crore production-linked mfg. incentives (PLI) to encourage companies in 10 sectors to boost local mfg. and increase exports. The auto sector, including vehicle makers and parts suppliers, will receive the biggest share at ₹57,000 cr. The export-related revenue and localization of production are the two primary criteria for benefits.

Fig 3 – Sector Wise Sales

  • The Corona pandemic caused a 2020 slowdown of Auto Industry, which was already been performing poorly in FY20. In FY21 auto companies are expected to have weaker sales numbers. Trading tension between India and China, can also affect the Industry, as 27% of auto parts are and imported from China. Indian mfg firms are looking for alternative to Chinese imports.
  • Millennials don’t prefer owing a car due to high maintenance cost and availability of local taxi rides.
  • Fig 3 explains the sales pattern of four sub-sectors of automobile sector for the period of five financial years. Figure clearly depicts that Indians preferably choose two-wheelers. Every sub sector has seen a downfall in FY20 after the increase in the recent years.
  • Two Wheelers – India is the largest mfg. of 2W in the world. 2W market has grown rapidly for Indians because of convenience and low cost of ownership and is expected to grow at a CAGR of 7.33%. Recently, industry has seen a downturn due to rising fuel prices, safety concerns, BS-VI norms and covid uncertainties. Motorcycle consisted of around 65% of the total 2W sales in the FY20, followed by Scooters and Mopeds with contribution of 32% and 3% respectively.
  • 2W sales in India reached an all-time high in 2019, when they sold some 2.1 crore units. This figure is almost double the 2011 sales, when just 1.18 cr. two-wheeler units were sold in India.
  • Passenger Cars – In Nov’20, India’s domestic PV sales rose 12.73%, due to ease in lockdown restrictions & increase in demand due to festive season. Maruti Suzuki has been a dominant player in PV sector, owning a market share of more than combined of all the rivals. Motor vehicle sales in India have doubled between 2008 and 2018, but has been seeing downward trend recently. Various regulatory norms have impacted the automobile sector to change their production methods leading to increase in cost.
  • Commercial Vehicles – In 2018, India was the world’s 3rd largest CVs market and the fastest growing globally. Various factors affect the sales of CVs i.e., mfg. and agricultural output. India has faced the shift of emission standards from BS IV to BS VI from April 2020 leapfrogging BS V, a move that is aimed to curb threatening levels of air pollution in urban areas. Many CV mfg firms are looking to adopt EV tech, keeping the future developments in consideration. Majority of the CVs are Load Carrier Light CVs (LCVs) followed by Medium & Heavy CVs (M&HCVs).

Fig 4 – Tractor Market

  • Tractors – The tractors market is quite dependent on the seasonal rainfall, overall GoI MSP and pricing, and demand conditions. This year has been positive for agriculture sector with good rainfall (in fact floods in some areas), firm GoI pricing and otherwise healthy demand. The migration of workers from urban to rural in May-June this year also helped in labour availability. The rural economy was relatively unaffected by lockdowns and covid. See Fig 4 – Tractor Market.
  • The tractor market was impacted by closure of dealerships, but rebounded well by June itself.
  • The new trend is development and export of cutting edge new tractors from India.

Why is Auto sector doing well in India?

  • The sector has grown on account of traditional strengths in mfg., and cost advantages of abundant low-cost skilled labor, and significant foreign direct investment (FDI) inflows.
  • The GoI has allowed 100% FDI under the automatic route. The GoI aims to develop India as a global mfg. center and a R&D hub. Under NATRiP, the GoI is planning to set up R&D centers at a cost of US$ 388.5 m to enable the industry to be on par with global standards.
  • With a population of more than 130 cr. people, the addressable market for vehicle sales is large. A growing working population and expanding middle-class have been the demand drivers for auto in India. We have the second largest road network in the world at 4.7m km. The GoI policy to set aside substantial investment layout for infra development in every 5-year plan has included the focus on roads. This has given a fillip to the demand for cars and other vehicles.
  • The global auto industry has embraced digital. Revenues generated by online vehicle retail, after-sales, and services are likely to grow almost five times, from about $120 billion in 2018 to about $605 billion by 2025. Volkswagen launched the Digital Workplace initiative across its dealerships in India around two years ago.
  • There are various developments in Indian Auto sector which has triggered its growth. In Sept 2020, Toyota Kirloskar Motors announced investments of more than ₹2,000 cr. in India directed towards electric components and technology for domestic customers and exports. Also, M&M signed a MoU with Israel-based REE Automotive to collaborate and develop commercial EVs. In April 2020, TVS Motor Company bought UK’s iconic sporting motorcycle brand, Norton, for a sum of about ₹153 cr., making its entry into the top end (above 850cc) segment of the superbike market.
  • India has engineering and design centers for many global auto firms. Here maintenance and upgrade work of current models as well as planning & engineering work for new launches, and product development work is done by skilled engineers in an IT enabled environment in close coordination with teams in many countries. Thus an auto ecosystem has developed in India of skills, local manufacturing, OEMs, components, and global business centers.
  • India also has various cost advantages. Auto-firms save 10-25% on operations vis-à-vis Europe and Latin America. India has a well-developed, globally competitive Auto Ancillary Industry and established automobile testing and R&D centers.
  • India is a prominent auto exporter and this segment may grow in the near future.

Benchmarking of Key Players

We have done a benchmarking of selected Auto sector players. Fig. 5 depicts the comparison between the selected Indian companies on basis of key parameters.

Fig. 5 – Benchmarking

  • In this peer group, Bajaj Auto showed best returns (ROCE & ROE) & even dividend yield, and is the lowest in terms of debt as well as being undervalued. Eicher Motor and Escorts were not far behind.
  • Profitability was negative in FY20 for Tata Motors & Mahindra and 3 year cagr profit is negative for many firms. The leader on this parameter is Escorts.
  • Margins are the best for Eicher Motor and next for Bajaj Auto. Eicher Motor has operations in niche high margin segment while Bajaj clearly shows once again its efficiency in operations.
  • Among these auto companies, the best positive outcomes and Score are of Bajaj Auto and Eicher Motors in two-wheeler segment, Escorts in Tractors and Maruti Suzuki in Passenger Car segment. TVS Motors and Tata Motors appear weak from this group.

Relative Prices

Fig 6 – Relative Prices

  • Fig 6 – Relative Prices shows the stock returns given by major listed Indian auto firms by keeping the base of prices as 29th Oct 2018. On the right side we can see the share price performance by order.
  • The share prices fell sharply when the first lockdown started, but soon had a V-shaped recovery. We can see that 7 of the 10 firms have emerged in the positive by now, over a 2 year period.
  • Escorts Group is the #1 in this group and has posted high returns of 140% gains. The agriculture sector has done well even in lockdown times and there has been a good rainfall too. Escorts Group has been increasing its market share by launching new models recently.
  • In the group #2 is Bajaj Auto, #3 is Eicher Motors, #4 is Hero Motocorp, and #5 is Maruti Suzuki. Relative underperformers are Ashok Leyland, Tata Motors and TVS Motors.

Future of the Indian Auto Industry

  • A young population, rising GDP and growing middle class will drive domestic demand for automobiles in India. This will be aided by a healthy domestic industry that is innovative and producing at scale.
  • Several Indian automobile firms have global expansion plans for sales, mfg. and exports. These include Eicher Motors, Hero Motocorp and Bajaj Auto. Maruti, Hyundai and Escorts among others use India facilities for exports.
  • India is expected to emerge as the world’s third-largest PC market by 2021. In FY 2018-19, sale of PC has increased by 2.70%, 2W by 4.86% and 3W by 10.27% as compared to FY 2017-18.
  • From just small cars, India will grow as a hub for design, components and mfg. of all automobiles.
  • Auto companies like Kia Motors, MG have entered the Indian market with premium vehicles and are making a mark by selling in higher volumes. Many automotive companies are looking to enter the business in India which can result in cut-throat competition, and will push Indian companies to innovate and increase the quality of their product to retain their market share.

Conclusion

  • Automobile sector will continue to grow in India due to rising domestic demand, growing strengths in outsourcing of engineering services to India, and global growth plans of Indian OEMs. The supporting ecosystem of auto component manufacture too is developing in tandem.
  • The weak INR may help India to be a good base for manufacture and global exports.
  • In 2W India is already #1. In the PC and CV categories, India became the #4 largest market in 2019 displacing Germany with about 3.99 m units sold. India may displace Japan for #3 by 2021.
  • The growing confidence and global growth plans of Indian auto firms can see the rise of many Indian auto MNCs in the next few decades.
  • The key new auto sector trends of digitalization, software based auto controls and EVs can also be accelerated by India based R&D and developer firms.
  • We can see from Fig 5 – Benchmarking and Fig 6 – Relative Prices that 6-7 firms out of the selected 10 for this study are performing well on many parameters and should continue to lead.
  • We recommend investors buy an Auto portfolio of Escorts Ltd., Bajaj Auto, Eicher Motors, Hero Motocorp, and Maruti Suzuki in equi-weight mode.

Disclaimer

This document has been prepared by JainMatrix Investments Bangalore (JM), and is meant for use by the recipient only as information and is not for circulation. This document is not to be reported or copied or made available to others without prior permission of JM. It should not be considered or taken as an offer to sell or a solicitation to buy or sell any security. The information contained in this report has been obtained from sources that are considered to be reliable. However, JM has not independently verified the accuracy or completeness of the same. Punit Jain has stock ownership positions in Escorts Ltd. (since Feb 2017) and Eicher Motors (since June 2017) out of all firms mentioned in this report, and they are small (<1%). Other than this, JM has no known financial interests in any firm mentioned here. Neither JM nor any of its affiliates, its directors or its employees accepts any responsibility of whatsoever nature for the information, statements and opinion given, made available or expressed herein or for any omission therein. Recipients of this report should be aware that past performance is not necessarily a guide to future performance and value of investments can go down as well. The suitability or otherwise of any investments will depend upon the recipient’s particular circumstances and, in case of doubt, advice should be sought from an Investment Advisor. Punit Jain is a registered Research Analyst under SEBI (Research Analysts) Regulations, 2014. JM has been publishing equity research reports since Nov 2012. Any questions should be directed to the director of JM at punit.jain@jainmatrix.com.

Burger King India IPO – Try the Whopper!!

  • Date 01st Dec; IPO Opens 2-4th Dec, at ₹59-60/share
  • Small Cap: ₹ 2,438 cr. Mkt cap
  • Sector – Restaurant chain, QSR
  • Valuations: P/E negative, P/B 10.5 times, EV/EBITDA 4.4.
  • Loss making entity; profit looks 2 years away, so this is a private equity type, high risk investment
  • Advice: SUBSCRIBE

Summary

  • Why Buy Now: The Burger King chain is at an early stage of growth in India. The organization and structure set up looks good to handle the growth imperatives.  
  • The Burger King brand is quite strong in India.
  • We expect profitability in BKG in 2 years, by FY23, even as it grows rapidly in revenues and outlets. Once this happens, BKG valuations will rise and this IPO entry price will look attractive.
  • Relative to other MNC QSR chains in India, BKG valuations look reasonable.  
  • It has handled the covid period well, reducing costs and getting by. We expect normalcy in revenues to return in H2FY21.
  • Risks: 1) Loss making entity; profitability looks 2 years away, so this is a private equity type, high risk investment 2) Intense competition from Indian and MNC QSR chains in Tier 1 towns 3) Covid induced challenges – demand from customers as well as employee health. 4) High royalties to Principal.
  • Opinion: Investors can SUBSCRIBE to this IPO with a 2 year perspective.

JainMatrix Subscription Pricing and Payment Options

JainMatrix Investments reports….

Here is a note on Burger King India IPO (BKG) IPO.

IPO Highlights

  • The IPO opens from 2-4th Dec 2020 in a Price Band of ₹ 59-60 per share
  • The IPO includes a Fresh Issue of ₹ 450 cr. and Offer for Sale (OFS) of 6 cr. shares. So the total IPO size is max 810 cr. of about 13.5 cr. shares, and about 35.5% of the equity share capital.
  • The promoter is QSR Asia and it owns 94% in BKG which will fall to 60% post-IPO.
  • The main objects of Fresh Issue are funding new Company-owned Burger King Restaurants by 1) Repayment of borrowings taken for this of ₹ 165 cr. and 2) Capex for new Restaurants ₹ 177 cr. 3) Remaining ₹ 108 cr. are for general corporate purposes like paying for this IPO.
  • The promoter is a PE firm and the listing will help to monetize and profit from investments. 
  • The lot size is 250 shares and Face Value ₹ 10 per share
  • The IPO share quotas for QIBs: Non-Institutional Investors: Retail is 75:15:10%.
  • The unofficial/ grey market premium of BKG is ₹ 20-25 /share over IPO price. This is a positive.

Introduction

  • Burger King India is one of the fastest growing international QSR (Quick Service Restaurant) chains in India, started in Nov 2014.
  • In FY20 the Revenues, EBITDA and Profits of BKG were ₹ 847 crore, ₹ 105 cr. and ₹ (77) cr. resp.
  • It already has 261 restaurants across 57 cities, including Delhi-NCR, Mumbai, Pune, Chennai, Hyderabad, Bengaluru, Chandigarh and Ludhiana.
  • The restaurants serve food and beverages, see Fig 1a, with offerings like:

Fig 1a – Menu Range, Fig 1b – Cluster Map and Fig 1c – Outlets by Region

  • The globally recognized Burger King brand, also known as the “HOME OF THE WHOPPER®”, was founded in 1954 in USA and is owned by Burger King Corp., a subsidiary of Restaurant Brands Intl. Inc. The Burger King brand is the #2 largest fast food burger brand globally by number of restaurants, with a network of 18,000 restaurants in 100 countries and USA.
  • BKG has used a well defined restaurant roll out and development process. The Principal (BKG AsiaPac) helps and supports in this process.
  • BKG AsiaPac has to be paid monthly royalty (of 4-5% of sales annually). BKG is also required to pay BKG AsiaPac a non-refundable one-time fee on opening each new BK Restaurant of US$15k (₹11.25L), increasing to $25k (19L) from CY 2020-22 and US$35k (26L) for all periods thereafter.
  • Everstone Capital, the Singapore-HQ India-focused mid-market PE firm, owns 99.39% stake in BKG India, through investment vehicle QSR Asia Pte Ltd.
  • As of Sept 30, the number of BKG employees was 4,836.
  • Key leaders: Shivakumar Pullaya Dega (Chairman and Independent Director), Rajeev Varman (CEO and Whole Time Director) and Abhishek Gupta (Chief of Biz. Dev. and Operations).

News, Updates and Strategies

  • Burger King India aims to have 370 stores (101 additional) by Dec 2022. Under the Master Franchise and Development Agreement (MDA), BKG is required to develop and open 700 restaurants (both Company-owned and Sub-Franchised) by Dec 2026. This agreement renewal is by Dec 31, 2039.
  • Fund raising through the IPO will be used for expanding its store base in India and reducing debt.
  • The Indian promoter is a private equity firm Everstone Capital, even as BKG works under a MDA with Burger King Corp. USA.
  • Based on the FIFO methodology, Everstone will earn 3.58 times returns on its 7-year investment. Its cost of investment (of the IPO shares) is pegged at ₹ 110 cr. In return, it will fetch ₹ 360 cr. from the partial exit at upper end of IPO band, per VCCircle.
  • The company’s average meal ticket size is ₹ 500-550.
  • Covid had a massive impact on BKG, as first a lockdown, and later the containment zones, lack of permission from authorities and public fear of infection kept away dine in customers.
  • BKG responded by reducing costs: it negotiated with landlords on rentals, reduced inventories, etc.
  • In Sept 2020, the number of BKG employees decreased to 4,836 employees compared to 6,141 in Mar due to attrition, effect of Covid, and redundancies.
  • On date of RHP of 25th Nov., out of 268 total restaurants, only 249 are operational.
  • BKG has a strong supply chain for all food ingredients and raw materials, to ensure traceability, freshness, long term contracts, low prices and quality ingredients.

Food Industry Outlook in India

Fig 2 – Food Services Segments
  • The Indian food service sector can be divided into 4 segments, see Fig 2.
  • QSR have fast food cuisines and minimal table service, and cater to youngsters and working professionals, offering quick delivery of food, good ambience and option of home delivery. QSRs generally target people in the 16-35 years range. Frequency of eating out (4-5 per month) is low so there is headroom to grow.
  • QSRs are the most preferred destination, followed by casual dining restaurants when it comes to eating out, per the India Food Services Report 2016, made by the National Restaurants Association of India (NRAI) and consulting firm Technopak Advisors Pvt. Ltd.
  • The most popular eating out options in India are North Indian food (28% of the time), followed by Chinese (19%) and South Indian style (9%), according to a Livemint.com report.
  • Restaurants, cafes and international fast food outlets have proliferated in India and eating out has become popular. About 81% of consumers prefer to eat out, and 19% get delivery or takeaway.
  • The QSR segment is nascent and has a lot of scope for growth in India. A large number of global QSRs have established their outlets with franchise rights of various companies like McDonalds, KFC, Pizza Hut, Subway, Taco Bell, Burger King and Domino’s, in addition to Indian QSRs.
  • BKG has a 5% market share in India’s ₹ 34,800 crore QSR market.
  • With factors such as urbanization, rising income levels and improved investment climate, the food service sector holds a huge opportunity. The sector has observed tremendous development in the past 3 years, which grew at 11% CAGR during 2015-19. The sector is estimated to grow at a 9% CAGR by 2022-23 (Source: NRAI India Food Services, IFSR 2019).
  • GST rate cut from 18% to 5% for the restaurant business was a significant tailwind for the sector, and generally led to a sharp recovery in SSSG’s.

Financials of BKG

  • BKG revenues, EBITDA and PAT over the years are in Fig 3a. The firm grew revenues well over 3 years, and is EBITDA positive but loss making.
  • A possible profit in FY21 quickly became a loss in H1 due to Covid.
  • In Fig 3b we can see that from a FCF positive FY18, the firm has made many investments and become FCF negative in FY19-20. We can also see the number of outlets by FY.

Fig 3a – BKG Financials and Fig 3b – Free Cash Flow

Benchmarking

We benchmark BKG against listed food service firms, entertainment firms and the principals. See Fig 4.

Fig 4 – Benchmarking

  • As a loss making firm, PE is negative for BKG. So valuations are tracked using P/B and EV/EBITDA. On these parameters, the valuations of BKG are lower than the others. This is positive.
  • Sales growth has been good at BKG. On Profits BKG is in the negative.
  • D/E ratio is low, may fall after IPO. One of the objects of the fresh issue in IPO is to reduce debt.
  • Margins are still on the lower side as BKG is building scale for its operations.
  • Return ratios are low due to losses.
  • The Revenue per outlet is low, perhaps reflecting BKG is a newer restaurant chain.
  • Putting this together, we sense that BKG is an asset available at low valuations due to current losses. It’s entirely possible that if not for covid, BKG may have been much less lossmaking by now. Post covid, BKG should focus on growth, with branch expansion, brand building and consumer loyalty.

Positives for BKG and the IPO

  • Burger King is a strong global brand. It’s been handled well so far in India with high street, airport and malls locations of restaurants, good visibility and positive customer reviews.
  • As a customer, my visit to BKG in 2018 in Bangalore was memorable and the focus is excellent with burgers available in both veg. and non veg. It was tasty and fairly priced, and a good experience.
  • The core offering of burgers can work for both snacks and meals for the Indian palate. Traditional consumers may not be satisfied as it’s a light fried meal, but others can find it novel and tasty. The BKG brand is well positioned for the millennial customers.
  • The global franchise model has succeeded for competitors in Indian markets, and the BKG rollout looks like a lower risk proposition that has a fairly unique offering and good chance of success.
  • The growth plans of 700 outlets by 2026 looks achievable and necessary to get a scale of operations.
  • The firm has an experienced, passionate and professional management team
  • Due to the covid infection, BKG has been able to bring down its costs structures. In particular, real estate costs for QSR may reduce and stay low for some time. Employee nos too have reduced.
  • BKG has an MDA with Burger King USA is till 2039, giving a good visibility.

Risks & Negatives for BKG in the IPO

  • The covid pandemic has been a blow as BKG has switched from a growth mode to a ‘cutting costs’ and survival mode for H1, to get by during this dip. Even today after most of the outlets reopened, there is a demand issue as customers are worried about public gatherings and infection spread. The economic impact of covid means that people celebrate less and even eating out may be done at more ‘economic’ or ‘reasonable’ priced outlets than BKG. At the luxury end, demand is down.
    • Having said this, our opinion is that in T1 cities, demand will normalize in Q3FY21 and a combination of takeaway and home delivery should be able to bring demand back.  
  • BKG has not declared a profit so far in all these years. As a result, the IPO has been allowed by SEBI but the Retail portion is retained at the lowest, 10% of shares offered, due to higher risks.
    • So on PE we have a negative value, but on other valuation parameters like PB and EV/EBITDA, BKG looks attractive and undervalued.
  • BKG directly competes with McDonalds and Subway in India on bread based light food options. Thus this QSR food subcategory looks a little crowded and top heavy.
  • BKG is at an early growth phase in its Indian network. There is a possibility that it may take several years to make a profit or dividend as it opens new outlets and invests in branding and supply chain.
  • Investors looking for normal valuation parameters may not find this attractive. Conversely this investment may only give good gains over several years.
  • Food delivery aggregators like Swiggy and Zomato intensify competition by offering massive choice and delivery to customers. BKG partners with them, but they get large commissions on orders.
  • Royalties for BK USA are high and a big hurdle to franchisee profitability. In FY18-20 they were ₹ 12, 24 and 34 crores for BKG.

Overall Opinion and Recommendation

  • QSR has a good future in India with improving affluence, and a growing eating out culture. Beyond the FY21 covid blip, this category should grow fast.
  • The social type businesses like BKG have been hardest hit by covid. As a result, the BKG IPO offering is undervalued. Most stock investors today are ignoring H1FY21 results, and high but temporary valuations, and expecting a full recovery by H2.
  • On a big picture basis, BKG is at an early stage of growth in India. The organization and structure set up looks good to handle the growth imperatives.  
  • We expect profitability in BKG in 2 years, by FY23, even as it grows rapidly in revenues and outlets. Once this happens, BKG valuations will rise and this IPO entry price will look reasonable.
  • Risks: 1) Loss making entity. Profitability also looks 2 years away, so this is a private equity type, risky investment opportunity. 2) Intense competition from Indian and MNC QSR chains in Tier 1 towns 3) Covid induced challenges – demand from customers as well as employee health. 4) High royalties.
  • Opinion: Investors with a risk appetite can SUBSCRIBE to this IPO with a 2 year perspective.

Disclaimer

This document has been prepared by JainMatrix Investments Bangalore (JM), and is meant for use by the recipient only as information and is not for circulation. This document is not to be reported or copied or made available to others without prior permission of JM. It should not be considered or taken as an offer to sell or a solicitation to buy or sell any security. The information contained in this report has been obtained from sources that are considered to be reliable. However, JM has not independently verified the accuracy or completeness of the same. JM has no stake ownership or financial interests in BKG or any group company. Punit Jain intends to apply for this IPO. Neither JM nor any of its affiliates, its directors or its employees accepts any responsibility of whatsoever nature for the information, statements and opinion given, made available or expressed herein or for any omission therein. Recipients of this report should be aware that past performance is not necessarily a guide to future performance and value of investments can go down as well. The suitability or otherwise of any investments will depend upon the recipient’s particular circumstances and, in case of doubt, advice should be sought from an Investment Advisor. Punit Jain is a registered Research Analyst under SEBI (Research Analysts) Regulations, 2014. JM has been publishing equity research reports since Nov 2012. Any questions should be directed to the director of JainMatrix Investments at punit.jain@jainmatrix.com.

UTI AMC is Losing Share (IPO)

  • Date 28th Sept; IPO Opens 29-01st Oct at ₹ 552-554
  • Valuations: P/E 25.4 times TTM
  • Mid Cap: ₹ 7,024 cr. Mkt cap
  • Industry – Asset Management
  • Advice: AVOID

jainmatrix investments, UTI AMC IPO

Summary

  • Key Strengths: UTI AMC is the second largest AMC in India in terms of Total AUM and the eighth largest in terms of mutual fund AUM. UTI has a strong brand due to its presence in India for 55 years. Valuations are low in terms of P/E. This allows some upside potential to investors. With a GoI institutional ownership, the firm is perceived as safe and stable. Post IPO, T Rowe Price will continue to be the largest shareholder.
  • Risks: 1) The financials of UTI have been weakening over the last 3 years. 2) The share of equity MFs has reduced in percentage, as the debt, liquid, hybrid, PMS and pension products grew faster. 3) Competition from the top 5 MFs is intense. With digital sales and distribution networks growing in importance for sales, UTI may have to invest more in sales and marketing. 4) AMCs are closely regulated by SEBI and are subject to changes or tightening of norms.
  • Opinion: UTI is a fair business available at a low valuation. AVOID this IPO.

Here is a note on UTI Asset Management Company (UTI) IPO.

IPO highlights

  • The IPO opens: 29/Sept – 01/Oct 2020 with Price band: ₹ 552-554 /share. Listing is 12/Oct.
  • Shares offered number 3.89 crore. The FV of each is ₹ 10 and market Lot is 27 nos.
  • The IPO is of ₹ 2,160 cr. for 30.75% equity by institutions SBI, LIC, and BoB who are selling 1.05 cr. shares each, and T Rowe Price and Punjab National Bank are selling 38 lakhs each.
  • UTI AMC is a institutionally owned firm with T Rowe Price (26%), and PNB, SBI, LIC, and BoB holding 18.2% each being the major shareholders.
  • The IPO share quotas for QIB, NIB and retail are in ratio of 50:15:35.
  • Grey market premium has dropped from ₹ 75 to ₹ 45 in the past few days of market volatility.

Introduction to UTI AMC

  • UTI AMC is the second largest AMC in India in terms of Total AUM and the eighth largest in terms of mutual fund AUM (June 30, 2020, by CRISIL). UTI AMC and its predecessor (Unit Trust of India) have been active in asset management for more than 55 years, having established the first MF in India.
  • Revenues and profit were ₹ 855 cr. and ₹ 276 cr. resp. for FY20. See Fig 1a. It has 1,386 employees with 658 in sales, 47 in investment, 278 in Support/other and 403 non-officers.
  • It has an AUM of ₹ 9,79,600 cr. in FY20 split between MFs (1,51,500 cr.) and Others (8,28,100 cr.).
  • We can see that Revenues, EBITDA and PAT have been falling for the last 3 years. See Fig 1a.
  • FY21-E is a projection based on Q1FY21 results and can be lower also.

jainmatrix investments, UTI AMC IPOFig 1a – Financials and Fig 1b – Free Cash Flowjainmatrix investments, UTI AMC IPO

  • Free Cash Flow has been positive but is also falling, See Fig 1b.
  • Mutual Funds are further split as equity oriented and others. See Fig 2a. UTI manages 153 domestic MF schemes, comprising equity, hybrid, income, liquid and money market funds as of June 30, 2020.
  • The market share of MF AUM is 5.6% among AMCs see Fig 2c.
  • Its distribution network includes 163 UTI Financial Centers, 257 Business Development Associates and Chief Agents and 43 other Official Points of Acceptance, most of which are in each case located in B30 cities. Its Independent Financial Advisors (IFAs) channel includes 53,000 IFAs.
  • UTI AMC has four sponsors SBI, LIC, PNB and BOB, each of which has GoI as a majority shareholder. It also has a global asset management company T. Rowe Price International Ltd as one of its major stakeholders with a 26% stake in the Company.
  • Post IPO, T Rowe Price will continue to be the largest shareholder. T Rowe Price is a USD 1 trillion (75 lakh crores INR) global asset manager based in USA.
  • UTI AMC has 11 million live folios making up 12.8% of client base of the Indian MF industry.
  • Leadership is Dinesh Mehrotra (Non-Exec Chairman Dir.), Imtaiyazur Rahman (Dir.- CEO), Amandeep Chopra (Gr. President, Head Fixed Income) and Vetri Subramaniam (Gr. President, Head Equity).

jainmatrix investments, UTI AMC IPOFig 2(a) – UTI AUM split – June 2020, 2(b) UTI Segment revenues and 2(c) Market share jainmatrix investments, UTI AMC IPOFig 3 – Shareholding Pre and Post IPOjainmatrix investments, UTI AMC IPO

MF Industry Outlook and Trends

  • The economy has seen financial events such as demonetization, RERA implementation, GST and a crackdown on black money and shell companies. All these have rekindled interest in financial assets as compared to real estate and gold which were the most popular earlier.
  • The Indian MF industry as a percentage of GDP increased from 4.7% in FY05 to 10.9% in FY20. This is much below the global average of 55%. There should be a steady growth in MF industry size.
  • The regulations and disclosures around MFs have ensured good traceability and audit trails. SEBI has promoted MFs as good entry level equity and debt products, and MF asset growth has been good.
  • The growth in the AUM has been supported by a favorable macro environment, the rising of capital markets, foreign fund inflows as well as growing investor awareness and trust in the MF products.
  • There are 44 AMCs registered in India. But the top 10 AMCs having 83% of the industry AUM, see Fig 1c. SBI, HDFC, ICICI Prudential AMC, Aditya Birla and Nippon are the 5 largest MFs.
  • Average MF AUM grew at 13% CAGR of from ₹7.6 trillion in Mar 2010 to ₹27 trillion as of Mar 2020.
  • Global asset management firms have struggled in India as independent MF firms. Many sold out and exited. They have had a better success rate on partnering with Indian firms as the MF JV promoter.
  • The regulator prescribes maximum Total Expense Ratios (“TERs”) for schemes, which are calculated by dividing the total costs of the fund by its total average assets. Aggregate scheme expenses, including all fees, commissions, costs, charges, and expenses, must not exceed the applicable TER for a scheme. TER is higher for equity MFs and lower for debt.

Benchmarking

We benchmark UTI AMC against 2 AMC firms, and 4 brokerages and wealth managers. See Exhibit 4.

jainmatrix investments, UTI AMC IPOExhibit 4 – Benchmarking

  • We can see that of the 3 AMCs, HDFC comes out leading on most parameters except valuations and dividend yield. UTI leads only in valuations.
  • Our conclusion is that UTI is a ‘fair business available at a good price’.

Positives for UTI AMC and the IPO

  • UTI has a strong brand due to its presence in India for 55 years.
  • Valuations are low in terms of P/E and P/B. This allows some upside potential to investors.
  • It is a large firm and has quasi government brand. Operations are all India.
  • The AUM by UTI is large, and particularly in Retirement it is a leader.
  • It is in the top 10 firms by MF AUM.
  • With a GoI institutional ownership, the firm is perceived as safe and stable.
  • Post IPO, GoI institutional ownership will fall to 49%, and may allow it to function like a private firm.
  • With financialization of savings growing, UTI should be able to grow AUM.
  • UTI has an experienced and stable management & investment teams.
  • T Rowe Price may take an active role in UTI, buy out shares from the market and take over UTI (it will trigger an open offer requirement) in future.

Risks and Negatives for UTI and the IPO

  • The key financials of UTI have been weakening over the last 3 years.
  • Partly this was because in 2019, SEBI reduced the TERs allowed for all MFs, impacting revenues and profits. AMCs are closely regulated by SEBI and is subject to changes or tightening of norms.
  • The equity part of UTI MFs reduced in percentage, as debt, liquid and hybrid products grew faster.
  • Competition from the top 5 MFs is intense. With digital sales and distribution networks growing in importance for sales, UTI may have to invest more in sales and marketing.
  • In July 2014, the holding period for long-term capital gains tax on debt MFs was increased from 12 to 36 months. It is possible that such regulatory changes can affect their business in future.
  • The tax on LTCG from equity was introduced in budget 2018 in Feb at 10%, from zero earlier. This caused a correction in markets, particularly the mid and small cap stocks, and MFs.
  • Competition to the MF industry is from alternatives like the PMS industry, AIF/ Hedge Funds, Private equity markets and direct equity advisory. Many of these are the next steps for MF investors after they have started their investment journey with MFs.

Overall Opinion and Recommendation

  • Mutual Funds industry in India has benefited from the financialization of assets, the growth of the digital economy and the entry of a wave of new investors in recent years.
  • However growth may be concentrated among the top 5-6 firms which already command 57% share.
  • UTI has a strong brand due to its presence in India for 55 years. Valuations are low in terms of P/E. But we can see that in last 2-3 years financials have weakened. While AUM has increased, UTI is big in low margin areas like retirement, pension and GoI PMS. We perceive UTI as a fair business available at a low valuation in IPO.
  • Risks: 1) The financials of UTI have been weakening over the last 3 years. 2) The equity share of MFs has reduced in percentage, as the debt, liquid, hybrid, PMS and pension products grew in share. 3) Competition from the top 5 MFs is intense. With digital sales and distribution networks growing in importance for sales, UTI may have to invest more in sales and marketing. 4) AMCs are closely regulated by SEBI and are subject to changes or tightening of norms.
  • Opinion: Investors can AVOID this IPO.

Disclaimer

This document has been prepared by JainMatrix Investments Bangalore (JM), and is meant for use by the recipient only as information and is not for circulation. This document is not to be reported or copied or made available to others without prior permission of JM. It should not be considered or taken as an offer to sell or a solicitation to buy or sell any security. The information contained in this report has been obtained from sources that are considered to be reliable. However, JM has not independently verified the accuracy or completeness of the same. JM has no stake ownership or known financial interests in UTI  AMC. Neither JM nor any of its affiliates, its directors or its employees accepts any responsibility of whatsoever nature for the information, statements and opinion given, made available or expressed herein or for any omission therein. Recipients of this report should be aware that past performance is not necessarily a guide to future performance and value of investments can go down as well. The suitability or otherwise of any investments will depend upon the recipient’s particular circumstances and, in case of doubt, advice should be sought from an Investment Advisor. Punit Jain is a registered Research Analyst under SEBI (Research Analysts) Regulations, 2014. JM has been publishing equity research reports since Nov 2012. Any questions should be directed to the director of JainMatrix Investments at punit.jain@jainmatrix.com.


Dilip Buildcon – Tunneling through!

  • Date: 18th Sept, 2020
  • Price: ₹ 374
  • Small Cap: ₹ 5,200 cr. Mkt cap
  • Industry – Roads Construction
  • Advice: Buy with a target of 810 in 2 years

jainmatrix investments, dilip buildcon

Summary 

  • Overview: Dilip Buildcon is an EPC firm undertaking projects in India in the roads, bridges, tunnels, etc. DBL’s revenue in FY20 was ₹ 9,725 crore and profits ₹ 358 cr. DBL’s revenues, EBITDA and PAT have grown at 41.2%, 41.1 and 27.9% CAGR from FY11-FY20. It’s a small cap but a sector leader.
  • Why Invest Now? Good growth in order book in Q1FY21. The Booked to Bill ratio rose to 2.84. Also DBL has diversified from primarily roads into attractive adjacent sectors like tunnels, mining, metros, airports and irrigation. It is also executing 2 large infra asset sale deals which will free up capital, improve returns, reduce debt and allow reinvestment in growth. The share is also sharply off 2018 highs and is available at a P/E of 18 times TTM. The macro is good with GoI investing heavily in infrastructure. Interest rates are falling and loans are easier to get.
  • Key Risks: 1) high debt and large working capital requirement 2) pledged shares 3) high competition 4) covid and weather disruptions 5) Roads Sector perception
  • Outlook: Investors can BUY the share a 2 year target price of ₹ 810.

Our other Roads related reports:

  1. Indian Roads Sector – A Delightful Drive Ahead? – Apr 2018

  2. H.G. Infra IPO – An Exciting Road Ahead – Feb 2018
  3. Here’s A Great Construction Achievement – July 2018
  4. Dilip Buildcon IPO – This Is A Rough Road – Aug 2016  (we have changed our opinion)

Here is our research report on Dilip Buildcon Ltd. (DBL).

Dilip Buildcon – Description and Profile

  • Dilip Buildcon (DBL) is an Engineering, Procurement and Construction (EPC) firm undertaking projects in India in the roads, bridges, tunnels, mining, metros, airports and irrigation sectors.
  • DBL’s revenue in FY20 was ₹ 9,725 crore and profits ₹ 358 cr. DBL’s revenues, EBITDA and PAT have grown at 41.2%, 41.1% and 27.9% CAGR from FY11-FY20.
  • DBL owns 12,901 vehicles and construction equipments, and employs 33,700 people.
  • DBL segment revenues for FY21 Q1 are: (a) Construction of roads and bridges – 88% (b) Mining – 1% (c) Irrigation projects – 1%. (d) Urban development – 10%
  • DBL is MP based but in Fig 1b we can see that projects are from all over the country.
  • As of Q1FY21, DBL had an order book of ₹ 26,115 cr. The Orders Booked to Billings ratio was at 1.96 times in Mar 20 has risen to 2.84 in Q1 giving good revenue visibility. Out of this 68% are central government projects and 32% state government projects.
  • Dilip Suryavanshi is CMD. He has 34 years’ experience in construction, and is President of the MP Builders Association. Devendra Jain is the CEO-ED and has 19 years’ experience in construction.
  • Shareholding of DBL is: Promoters -75%, MF – 9.5%, FII – 8.7%, Public – 6.7%.


JAINMATRIX INVESTMENTS – PRICING AND PAYMENT OPTIONS

Liked this report? Get such reports privately in your mailbox with a subscription. 

Business Model, News and Updates for DBL

  • DBL’s strategy going forward is to (a) focus on road EPC for government clients (b) divest BOT assets freeing capital (c) geographical diversification (d) projects clustering (e) Target smaller project size to reduce overdependence on large projects (f) Deleverage balance sheet.

jainmatrix investments, dilip buildconFig 1(a) – DBL Segment Revenue in FY20 and Fig 1(b) – State wise Order Book (clickable)

  • It has a policy of no subcontracting and no equipment on rental. This has helped it build good human resource and execution capabilities. They do a faster execution of projects. DBL has completed 90% of their projects early, and has received bonuses of ₹ 565 cr. from 2012-20.
  • DBL carefully selects projects and strives for geographical clustering of these outside MP. This helps in utilization of construction assets and reduce environmental and forest clearance risks. It also paves the way for regional strengths. DBL leverages its manpower, equipment and materials and saves transportation costs, thus achieving economies of scale.
  • Drones and UAV are emerging technologies used to reduce project time, improve safety and control project costs. UAV is used to collect engineering data at a construction site.
  • GPS technology is used to track machine life, fuel usage, and consumables. It provides mapping and replays vehicle location history with real time alerts and notifications. Using this tech, DBL is able to guide drivers and operators, enabling fuel savings of ~25%.
  • DBL has received a LoA for construction and upgrading of NH 131A near Narenpur to four-lane and near Purnea to two-lane with paved shoulders in Bihar on HAM mode, of value ₹ 1,960 cr.
  • DBL in Aug 2018 won a contract of Pachhwara Central Coal Mine for 55 years valued at ₹ 32,156 cr., located in Jharkhand. The Pachhwara Block is reserved for Power Sector end use and was allotted to Punjab State Power Corp by GoI. DBL will develop this in consortium with VPR Mining where DBL will hold 74% equity. It expects to generate annuities of ₹600 cr. and margins in line with the current road business.
  • In June 2012 Income Tax dept. conducted raids on promoter Dilip Suryavanshi, teacher-turned local business tycoon Sudhir Sharma and associates at 10 locations, including Indore and Bhopal in MP. The officers found incriminating documents related to tax evasion. The ED later sought details from the IT dept. regarding an alleged ₹ 140 cr. FEMA violation from South Africa. (TOI news).
  • As a part of Business Continuity Measures (BCM), DBL imposed the (WFH) policy and this was identified as major relaxation for working in the COVID-19 pandemic environment.

Industry Outlook

  • India has the 2nd largest road network in the world, aggregating to 61 lakh kms. Roads are the most common mode of transportation and account for 86% of passenger and 65% of freight traffic. In India, National Highways with length of 1.04 L km are just 1.7% of the road network, but carry about 40% of the road traffic. On the other hand, state roads and major district roads at the next level carry another 60% of traffic and account for 98% of road length.
  • There are 2 central Govt. bodies which award road projects, NHAI which is in charge of the National Highway Development Program (NHDP) and Ministry of Road Transport and Highways (MoRTH), which covers highways not under NHDP.
  • From the Fig 2 below we can see the transition of projects awarded to new models recently.

jainmatrix investments, dilip buildcon Fig 2 – Road Project Models (click on images to enlarge)

  • NHAI has set an aggressive timeline for highways, expressways and economic corridors, to be ready by Mar 2025. The combined length of these is 7,800 km and would require investment of approximately ₹ 3.3 Lakh cr. in the next five years.
  • NHAI has constructed 3,979 km of NHs in FY19-20, the highest ever achieved in a financial year.
  • GoI has envisaged a highway program Bharatmala Pariyojana for development of 65,000 km of NHs. Under Phase-I of the program, GoI has approved implementation of 34,800 km of NH projects with a stiff target of 5 years with an outlay of ₹ 5.35 L cr.
  • Highway construction in India increased at 21.4% CAGR between FY16-19. In FY19, 10,855 km were constructed, and GoI has set a target for constructing 12,000 km of NH in FY20.
  • The development of road infra in India is witnessing great momentum and construction of roads per day hit a new high of 27 kms/day for FY18, which is much higher than what was achieved earlier.

jainmatrix investments, dilip buildconFig 3 – Construction, Outlay and Projects Awarded

  • Under Union Budget 2020-21, GoI allocated ₹91,823 cr. to MoRTH, and plans to invest ₹ 15 lakh cr. in the next five years. CRISIL expects investment in roads to double to ₹10,70,000 cr. over 5 years.
  • The GoI approved the Bharatmala program under which 53,000 kms of NHs have been identified to bridge critical infra gaps. It will give the country 50 national corridors as opposed to 6 at present. Phase I will be over FY18-22 with 24,800 kms of construction expected.
  • Construction of roads generates employment and contribution to growth in GDP.
  • In recent times, the InvIT structure has become popular for holding and listing of infra assets. This structure is tax efficient and allows infra firms to monetize their assets.

Stock evaluation, Performance and Returns

  • DBL’s revenues, EBITDA and PAT have grown at 41.1%, 41% and 27.9% CAGR from FY11-20.
  • DBL’s price history is detailed in Fig 4. The share price high was ₹ 1,247.5 in May 2018.

jainmatrix investments, dilip buildcon
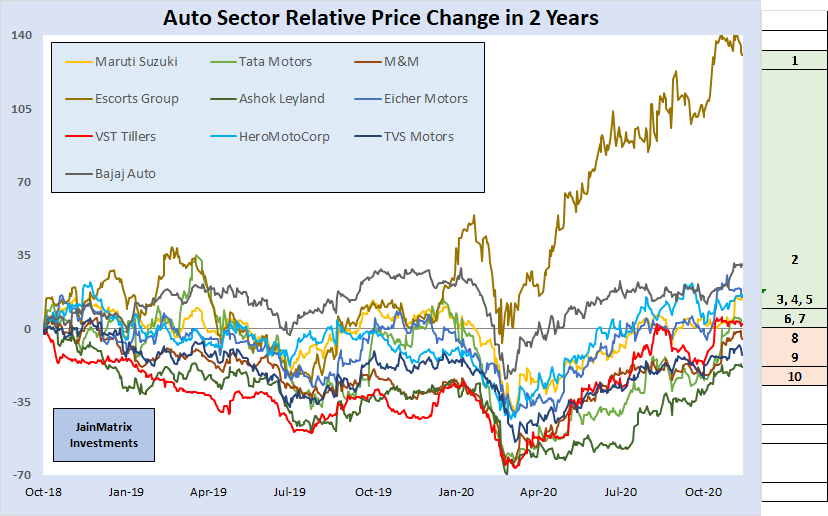
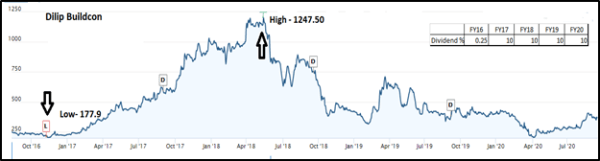
Fig 4 – Price History

jainmatrix investments, dilip buildconFig 5a – DBL Financials (click on images to enlarge)

  • DBL’s revenue was ₹ 1,892 cr. in Q1 FY21, a decrease of -17% YoY. PAT also fell by -70% YoY to ₹ 34 cr. in Q1 FY21 largely due to the impact of covid-19 and lockdown, see Fig 5a. We can also see that Sept quarter is typically weakest, mostly as the rains slow the construction for roads.
  • They paid a dividend of ₹ 1/share (Rate of 1%) in FY20, a yield of 0.11% which is very small.
  • DBL has not been able to generate Free Cash Flow in the last 6 years in-spite of good Cash from Operations due to the large CAPEX needs . This is common across the industry. See Fig 5b – Cash Flow. We can also see some of the key Financial metrics in Fig 5c.

jainmatrix investments, dilip buildconFig 5b – DBL Cash Flows and Fig 5c – Financial Metrics 

  • It had a Booked to Billed ratio of 1.96 (FY20) which rose to 2.84 in Q1FY21 on wins, see Fig 5d.
  • DBL has a ROE of 11.21% in FY20.
  • It secured record orders worth ₹ 10,703 cr. in Q1FY21 across 4 sectors and 5 states including 2 new states of Uttarakhand and Bihar, see Fig 5e.
  • It is getting more diversified, and now has over 50% of Order Book from non – Road sector.
  • The promotors hold 75% shares. However 21.5% of shares have been pledged by them.
  • In Fig 6a, we see the PE chart for DBL has a historic average of 16.25 times and a range of 7.5-25 times in 4 quadrants. Today at 23.5 times, it is trading near its historic averages.
  • In Fig 6b we can see that the EPS TTM had decreased in the last year due to nationwide lockdown.

jainmatrix investments, dilip buildconFig 5d – Order Book to Billed and Fig 5e – OB in Q1FY21

jainmatrix investments, dilip buildconFig 6a – Price – PE graph

jainmatrix investments, dilip buildconFig 6b – Price – EPS graph

Benchmarking and Financial Estimates

jainmatrix investments, dilip buildconFig 7a – Benchmarking

We benchmark DBL against peer road construction companies. See Fig 7a.

  • DBL appears to be at slightly expensive valuations in terms of P/E and P/B.
  • Sales and profits growth while impressive is not the highest.
  • Debt equity ratio is high at 2.62, a problem in the sector but DBL is highest in this peer group. However Net Debt to Equity is 0.92. EBITDA and Profit margins are low. However, their strategy helps DBL grow its revenues faster. RoE, RoCE are fair.
  • Financials of DBL are projected for 2 years in Fig 7b basis order book, corporate plans, management guidance and analyst judgement.

jainmatrix investments, dilip buildconFig 7b – Financial Projections

Strengths of DBL

  • DBL is a sector leader in Indian roads EPC. It has a large order book and rising revenues.
  • DBL has a good pan India presence. It operates in geographical clusters for projects which helps with efficiency and asset utilization. So DBL has an efficient business model. The execution through strong operations helped DBL receive early completion bonuses for many projects.
  • DBL has seen a strong growth in financials and order book. In Q1FY21, it has improved order book and also diversified into new infra verticals like tunnels and irrigation projects, amid the lockdown challenge.
  • Diversification by DBL from roads to a number of adjacent infra sectors is a sign of aggression and dynamism. There are business model synergies with these sectors and they are high potential sectors.
  • The sale of road assets to Shrem and Cube Highways is helping reduce capital tied up and so debt is being reduced. DBL should be able to sharply reduce its interest payments by continuing to sell road assets as well as take advantage of the lower interest regime and reduce cost of loans.
  • Key assets are large employee strength and construction assets. It also has a factory campus in Bhopal.
  • Road projects used to be riskier earlier as NHAI etc. used to bid out projects while having acquired only a small portion of the land required for construction. Projects used to get delayed and the Construction firm used to suffer. This has now changed and most of the land is acquired before bidding it out.
  • Promoters Dilip Suryavanshi, Devendra Jain and top management are highly experienced in infra space.
  • Largest Caterpillar equipment fleet owning company in Asia.

Weaknesses and Risks of DBL

  • All firms in the roads EPC sector face issues like high working capital requirement, long project gestation periods, govt. clearances, govt. customers and PIL/ litigation issues. DBL is no exception.
  • D/E is high at 2.62 times and interest payments have been rising. However Net Debt to Equity is 0.92.
  • The promoter Dilip Suryavanshi is alleged to have a close relationship with the CM of MP, Mr. Shivraj Singh Chauhan. However he became CM again only recently. Further their business has gone national.
  • The 2012 IT Department case of tax evasion and FEMA is an issue. While the firm is attempting to settle this issue, there is no clarity on additional tax liabilities, or even more such cases against the firm.
  • The 3 promoters are paid high salaries. This is not shareholder friendly. But it is in acceptable limits.
  • The promoter has pledged 21.5% of shareholding, however this is only till award of certain projects. The pledges will be released as soon as they receive financial closure on the same from banks. But pledging of shares by promoters reduces the stability of the share in the market.
  • Competition is intense in road projects, particularly in EPC projects rather than BOT.
  • Sector perception: the roads construction sector is seen as a tough business with challenges like litigation, high working capital, opaque GoI clients and a difficult business model.
  • The Land acquisition Act in India specifies the process and compensation. It has undergone several changes recently, and we expect more changes. The uncertainty affects the roads EPC industry.
  • BOT projects are evaluated based on traffic projections. In this sector, BOT companies are facing financial pressures due to aggressive projections during evaluation and high competition during bidding.
  • High interest payments compared to earnings.
  • The covid infection affected operations in Q1, but by August, labour availability is 90% of normal.

Overall Opinion

  • There is an urgent need to build infrastructure such as roads and highways. This is reflected in the Indian budget allocations. Project awarding and completion has never been so fast in roads sector.
  • In this sector Dilip Buildcon has built a good momentum of business, and has a national presence, a fast growing order book that is diversifying from roads to attractive adjacent sectors like bridges, tunnels, mining, metros, airports and irrigation. It has a good strategy and business model.
  • Road projects undertaken include work on BOT, HAM and EPC models. However two recent large deals of sale of infra assets is releasing tied up capital and helping focus on core EPC.
  • Key Risks: 1) high debt an large working capital requirement 2) pledged shares 3) high competition 4) covid and weather disruptions 5) Sector perception
  • Excellent financial management, galloping revenues and order book, sectoral tailwinds along with a low price entry point makes Dilip Buildcon an excellent BUY.
  • Investors can BUY the share with a 2 year price target of ₹ 810.

Disclosure, Disclaimer and Assumptions

The target price has been arrived at using financial projections in Fig 7b and a target PE of 15 times. This document has been prepared by JainMatrix Investments Bangalore (JM), and is meant for use by the recipient only as information and is not for circulation. This document is not to be reported or copied or made available to others without prior permission of JM. It should not be considered or taken as an offer to sell or a solicitation to buy or sell any security. The information contained in this report has been obtained from sources that are considered to be reliable. However, JM has not independently verified the accuracy or completeness of the same. Punit Jain has an equity ownership (<1%) in DBL since Sept 2018. Other than this he has no financial interests in DBL or any group company. Neither JM nor any of its affiliates, its directors or its employees accepts any responsibility of whatsoever nature for the information, statements and opinion given, made available or expressed herein or for any omission therein. Recipients of this report should be aware that past performance is not necessarily a guide to future performance and value of investments can go down as well. The suitability or otherwise of any investments will depend upon the recipient’s particular circumstances and, in case of doubt, advice should be sought from an Investment Advisor. Punit Jain is a registered Research Analyst under SEBI (Research Analysts) Regulations, 2014. JM has been publishing equity research reports since Nov 2012. Any questions should be directed to the director of JainMatrix Investments at punit.jain@jainmatrix.com.

Happiest Minds IPO – Ride the Digital Wave

  • Date 05th Sept 2020; IPO Opens 7-9th Sept at 165-166/share
  • Valuations: P/E 34 times FY20, P/B 7.6 times (Post IPO)
  • Small Cap: ₹ 2,438 Mkt cap
  • Sector – IT Services
  • Advice: SUBSCRIBE

Here is a note on Indian Happiest Minds Technologies Ltd (HMT) IPO. jainmatrix investments, happiest minds

Summary

  • Key Strengths: HMT is a small but fast growing IT services firm with a focus on digital services.
  • HMT concentrates on new and emerging technologies, platforms and ecosystems, which have a greater impact on customers and help HMT stand out in a crowded industry.
  • The promoter Ashok Soota, is a successful executive and serial entrepreneur.
  • The Covid pandemic has accelerated outsourcing, offshoring and demand for digital services.
  • In FY20 the Revenues, EBITDA and Profits of HMT were ₹ 698 crore, ₹ 101.9 cr. and ₹ 71.7 cr. resp. In just 9 years the firm has gone from startup to $100 million of revenues, and Rs 100 crores of EBITDA, it is a good achievement.
  • Risks: 1) Valuations at PE of 34 times and PB of 7.6 times (TTM) are expensive. 2) Intense competition 3) Covid induced challenges – demand from customers as well as employee health 4) Rupee strengthening against USD
  • Opinion: Investors can SUBSCRIBE to this IPO with a 2-3 year perspective.

IPO highlights

  • The IPO opens from 7 – 9th Sept 2020 in a Price Band of ₹ 165 – 166 per share
  • The IPO includes a Fresh issue of ₹ 110 cr. and an Offer for Sale of 3.56 cr. shares. So the Total IPO size is max 702 cr. of about 4.2 cr. shares.
  • This will be about 28% of the equity share capital of HM.
  • The lot size is 90 shares and Face Value ₹ 2 per share
  • The IPO share quotas for QIBs: Non-Institutional Investors: Retail is 75:15:10%.
  • The promoter & promoter group owns 61.8% in HMT which will fall to 53.3% post-IPO. Th other seller is CMDB-ll (JP Morgan Asset Management).
  • The unofficial/ grey market premium is ₹ 115-125 /share over IPO price. This is a positive.

Introduction

  • Happiest Minds Technologies provides end-to-end solutions in digital business, product engineering, infrastructure management and security services. It was incorporated in 2011.
  • The FY20 Revenues, EBITDA and Profits of HMT were ₹ 698 crore, ₹ 101.9 cr. and ₹ 71.7 cr. resp.
  • It offers solutions across the spectrum of digital technologies such as Robotic Process Automation (RPA), Software-Defined Networking/Network Function Virtualization (SDN/NFV), Big Data and advanced analytics, Internet of Things (IoT), cloud, BPM and security.
  • There are 3 key divisions: the Product Engineering Services (PES) unit helps by transforming the potential of digital by making the product secure and smart. The Infra Management (IMSS) provides an end to end monitoring and management capability for applications and infrastructure. The Digital Business (DBS) is focused on digital content management, connected retail and other customised offerings for clients.
  • In FY20, 96.9% of revenues were from digital services, one of the highest among Indian IT companies. See Fig 1 a, b and c for details of revenue by Service Lines, Industry and Geography. d) gives us the trends in onsite: offshore employee deployments.

jainmatrix investments, happiest minds

Fig 1 – HMT FY20 Revenues by (a) Service Lines (b) Industry Vertical and (c) Geography      (d) Onsite share (clickable)

  • HMT has 79% USA based business, higher than most Indian IT firms where it is 65-70%.
  • The HMT philosophy is quite simple – that the happiest people make happiest customers. Thus there is a focus in the company to keep employees motivated, engaged and happy.
  • The business units of the company are assisted by the 3 Centers of Excellence which are Internet of Things, Analytics / Artificial Intelligence, and Digital Process Automation.
  • As of FY20, the company had 157 active customers with average revenue per customer at USD 614,675. Its repeat business (revenue from existing customers) has steadily grown and contributes a significant portion of revenues.  There is a high degree of customer stickiness.
  • It has 2,439 employees.
  • Happiest Minds delivers services across industry sectors such as Retail, Edutech, Industrial, BFSI, Hi-Tech, Engineering R&D, Manufacturing, Travel, Media and Entertainment.
  • Key leaders: Ashok Soota (77, Promoter, Exec. Chairman-Dir.), V. Narayanan (ED-CFO) J. Anantharaju (V. Chairman, President-CEO PES), Rajiv Shah (Pres-CEO DBS) and C. Ramamohan (Pres-CEO IMSS).

News, Updates and Strategies

  • Deep Tech can Enable Business Growth: Per a news report, HMT has Deep Tech capabilities like AI, 5G, Blockchain, drone-tech, 3D printing, advanced material, quantum computing, biotechnology, etc. These emerging technologies are powerful and can solve specific business problems, and enable growth for clients. The adoption has accelerated post Covid.
  • Happiest Minds is India’s Top 25 Best Workplaces in IT & IT-BPM – Nov 2019.
  • However attrition was high at 19 %, higher than industry levels of 17-18%.
  • Happiest Minds has positioned itself as “Born Digital, Born Agile”.
  • The IPO share quotas indicate a tilt towards QIB, with smaller quotas to NII and Retail.
  • The Digital Content Monetization is a software as a service platform from HMT that helps firms digitize and monetize their content, delivering it to their customers, partners, and users. DCM comes with consumption-based pricing, and is powered by IBM Cloud.
  • Post Covid, the Indian IT services firms are seeing a surge in offshoring biz. This may be due to cost pressures from clients, or even a change in attitude caused by Work from Home (WFH) as firms allow employees to WFH to stay safe and productive during the pandemic.
  • The Covid pandemic has accelerated investments in technology infra as corporates have upgraded to allow WFH and also redesigned the customer and employee interactions.
  • HMT works with partners like Microsoft, Amazon Web Services, McAfee, IBM, PTC, etc.
  • On Sept 4 HMT raised ₹ 315.9 cr. from 25 anchor investors, ahead of its IPO. Anchor investors included Govt. of Singapore, Pacific Horizon Investment Trust, Integrated Core Strategies Asia Pte, Aditya Birla Sun Life MF, Axis MF, Goldman Sachs India Fund, HDFC Life Insurance, Franklin Templeton MF, ICICI Prudential MF, Kuwait Investment Fund, Fidelity Asian Values Plc and SBI MF.

IT Services Industry Outlook in India

  • The global sourcing market in India continues to grow at a higher pace compared to the IT & BPM industry. India is the leading sourcing destination globally, accounting for 55% market share of the US$ 200-250 billion services sourcing business in 2019-20. Indian IT & BPM firms have set up over 1,000 global delivery centers in 80 countries across the world. (IBEF)
  • IT & BPM industry global revenue was US$ 191 billion in FY20, growing at 7.7% y-o-y. It is estimated to reach US$ 350 billion by 2025. Moreover, revenue from the digital segment is expected to form 38% of the total industry revenue by 2025. (IBEF).
  • The Covid pandemic has sharply accelerated the adoption of digital solutions and automation across corporates and personal consumers. The safety and isolation requirements for employees in factories and offices and individual consumers has resulted in high demand for eCommerce based purchasing, employee WFH solutions, video call services and demand for contact free work and customer interaction solutions.
  • While the pandemic has accelerated the demand for digital, it is unlikely that the trend will reverse, as it has benefited productivity and efficiency. For example WFH may partially reverse in time but it may emerge as a permanent option as it has been widely accepted.

Financials of HMT

  • HMT’s revenues, EBITDA and PAT over the years are in Fig 2. The firm moved from losses in FY18 to good profits by Q1FY21. EBITDA and PAT margins have improved from FY18-20.
  • EPS too is sharply up, from losses in FY18 to an excellent result in Q1FY21.
  • In Fiscal 2018, HMT had restated loss for the year of ₹22.5 cr. This was due to relatively lower revenue from contracts with customers and higher employee benefit expense and finance costs. Further, to write off accumulated losses, the Company reduced the Securities Premium Account of HMT by ₹159.5 cr., after approval from the NCLT, Bengaluru bench through its order to the scheme of reduction of capital filed by HMT.
  • RoCE was 28.9% and RoE was 27.1% in FY20, a positive.

jainmatrix investments, happiest minds

Fig 2 – HMT Financials (clickable)

Benchmarking

We benchmark HMT against listed small IT service firms and the leader TCS. See Fig 3.

jainmatrix investments, happiest minds

Fig 3 – Benchmarking (clickable)

While the other firms are larger than HMT, we can draw some parallels:

  • The valuations of HMT are higher than all the others.
  • Sales growth has been good a leader in HMT. Profits cant be measure as HMT was loss making to years ago.
  • D/E ratio is highest here. One of the objects of the fresh issue in IPO is to reduce debt.
  • Margins are still on the lower side as HMT is building scale for its operations.
  • Return ratios are high while not being highest.
  • The Revenue per employee is low, indicating that HMT is investing in employees for growth.

Positives for HMT and the IPO

  • Ashok Soota is the promoter, he has a great track record as a software executive at Wipro, and serial successful entrepreneur who started (and created great value with) Mindtree and now Happiest Minds. He has built great teams in these firms. He is well known also due to several books he has written on entrepreneurship. Many investors will be drawn in by him, to buy into this, his next firm. However at 77, he may be unlikely to be able to take an active / executive role in the firm.
  • However there is a solid next line of management team in place at HMT.
  • HMT says it is “Born Digital, Born Agile” and has over 90% of revenues from digital services, quite higher than most other Indian services firms. There is no doubt that digital services are a high demand, cutting edge space with better growth prospects.
  • The Indian IT services firms are generally debt free, high cash and RoE generating firms once they stabilize operations. HMT should be able to do this in 1-2 years post IPO.
  • The philosophy at Happiest Minds is simple yet powerful – that happy employees ensure happy customers. While this is well known, there appears a special focus on this at HMT.
  • In just 9 years the firm has gone from startup to $100 million of revenues, and Rs 100 crores of EBITDA, is a good achievement.
  • The covid pandemic offers an opportunity to grow faster as customers are forced to work remotely and need more solutions and support.

Risks and Negatives for HMT and the IPO

  • Valuations at PE of ~34 times and PB of ~7.6 times (FY20 trailing basis) are expensive. However a premium is usually demanded by good quality firms in their IPOs.
  • While HMT may present a digital focus, and a large percentage of business from digital, most Indian software services firms have a digital business segment, and their significant legacy businesses may actually offer an opportunity to add a digital layer. So competition is intense for HMT and the key in IT services has always been to adopt and absorb new technologies fast and roll these out to clients.
  • HMT appears to be just another vanilla 1st generation IT services firm, when we are already seeing the 2nd generation services firms focused on Engineering R&D, Pharma R&D, legal, etc.
  • The 79% tilt to USA of business can be a constraint if visa availability declines there.
  • The financial performance of HMT has been uneven, and there’s no certainty that the solid FY19 and FY20 will be followed by a good FY21 post IPO.
  • While Covid offers some opportunities, there is no doubt that many economies are entering a recession and corporate spending for the most part may reduce over the next 1-2 years.
  • IT services are facing competition from 1) the enterprise Product firms 2) the large application and product firms dedicated to Google Android, Apple and Microsoft platforms and 3) the Social Media firms.
  • The INR:USD is at 73.3 today. After many years of 5% a year average weakening of INR against USD, in the last few months the trend appears to have reversed. Indian economic factors such as lower crude prices, lower gold imports, international trade surplus, large forex reserves, falling fiscal deficits and USA Fed policies all point to a stable or strengthening of INR against USD. We expect INR to be in a 70-75 range against USD over the next year.

Overall Opinion and Recommendation

  • IT services are always going to be needed to stitch together solutions for their clients, and to help them navigate, evaluate and deploy the complex IT landscapes and technology options. Indian IT services companies have time and again proven their mettle and have the skilled resources and project management skills to deliver successfully.
  • Happiest Minds as a small-cap firm has many of the quality ingredients required to succeed including great management, new digital tech focus and good employee policies.
  • If HMT continues its growth story over 5 years, this IPO entry price will look quite reasonable.
  • Risks: 1) Valuations at PE of 34 times and PB of 7.6 times (TTM) are expensive. 2) Intense competition 3) Covid induced challenges – demand from customers as well as employee health 4) Rupee strengthening against USD
  • Opinion: Investors can SUBSCRIBE to this IPO with a 2-3 year perspective.

Disclaimer

This document has been prepared by JainMatrix Investments Bangalore (JM), and is meant for use by the recipient only as information and is not for circulation. This document is not to be reported or copied or made available to others without prior permission of JM. It should not be considered or taken as an offer to sell or a solicitation to buy or sell any security. The information contained in this report has been obtained from sources that are considered to be reliable. However, JM has not independently verified the accuracy or completeness of the same. JM has no stake ownership or financial interests in HMT or any group company. Punit Jain intends to apply for this IPO in the Retail category. Neither JM nor any of its affiliates, its directors or its employees accepts any responsibility of whatsoever nature for the information, statements and opinion given, made available or expressed herein or for any omission therein. Recipients of this report should be aware that past performance is not necessarily a guide to future performance and value of investments can go down as well. The suitability or otherwise of any investments will depend upon the recipient’s particular circumstances and, in case of doubt, advice should be sought from an Investment Advisor. Punit Jain is a registered Research Analyst under SEBI (Research Analysts) Regulations, 2014. JM has been publishing equity research reports since Nov 2012. Any questions should be directed to the director of JainMatrix Investments at punit.jain@jainmatrix.com.


Save Vodafone Idea

jainmatrix investments

Preface / introduction

  • JainMatrix Investments has been tracking the Indian telecom sector, since the days of BSNL and MTNL monopoly, the go-go days of mobile introduction, the rise of Bharti Airtel and the entire sector over 2000-10 with 5-6 players, the high competition over 2010-14, the consolidation over 2013-18, and the rise of Reliance Jio.
  • The mobile sector is still under stress today, reduced to a 4 player industry, including a PSU. Telecom prices are among the lowest in the world, barely supporting their operations.
  • Post Covid, telecom services have enabled many people to Work From Home (WFH) and in general stay safe from infection worries. It is critical infrastructure.
  • Player #3 is Vodafone Idea (VIL) with a ₹25,000 crore market cap, revenues of ₹45,000 cr. but operating losses in FY20, a book value of ₹6,000 cr. and a CMP of ₹8.6. Mobile subscribers number 31.9 cr.
  • VIL has Adjusted Gross Revenue (AGR) dues to Govt. of India (GoI) of ₹50,399 cr. These are either to be paid immediately (impossible) or over a 20 year period (under negotiation and subjudice due to a running court case).
  • Let me start with the worst case scenario –

What if Vodafone Idea goes bankrupt:

  • The National Company Law Tribunal (NCLT) may have to be brought in to start a painful 2-3 year process of Insolvency and Bankruptcy Code (IBC).
  • The AGR dues to GoI of ₹ 50,399 cr. would be struck off.  GoI will get next to nothing back.
  • The debt of VIL of ₹ 112,520 cr. owed to banks and institutions will become almost worthless, taking down many lending Banks and funding agencies with it. This can be a worse and more painful disaster than the IL&FS collapse a few years ago.
  • Vendors are owed at least ₹ 4,000 cr. for equipment, and would start litigation to recover.
  • Subscribers numbering 31.9 crores would be affected. Their services will be disrupted and it will be difficult and time consuming to switch providers.
  • The 18,500 VIL employees would lose their jobs. A lot of working telecom assets would be damaged, destroyed or wasted.
  • India would lose face with the international business community. Another massive loss by a reputed MNC (Vodafone) in India would spoil our Ease of Doing Business ranks
  • The TRAI and Telecom department would become perhaps the worst Indian regulator, as along with our Justice system it has overseen the transition of a 14 player healthy telecom sector, to a monopolistic, damaged, in-reality 2 player industry, in a short 10 year period. The mobile penetration in India has also actually fallen in the last 1 year.
  • The sector would become a virtually 2 player monopoly with no competition. In such a market the price of mobile services can easily rise 2-5X within 2 years, as surviving telecom firms will have a free hand. TRAI and Dept. of Telecom will not be able to control the rise, just as they have been unable to control the fall of service prices in the last 5 years.

While its expected for some firms to fail in an open economy, VIL failing is clearly a disaster that should not happen.

Whats the solution?

  • This solution should be seen as an emergency one time effort, not a solution that can be repeated or generalized for other companies or sectors.
  • All AGR dues to GoI should be paid by VIL equally over a 20 year period, with interest.
  • The annual AGR dues should be collected by GoI every year in the form of fresh equity issued by VIL at the then value of market capital of the firm. Thus GoI becomes a stakeholder of VIL to the extent of its equity holdings in it and payments due.
  • GoI must have a 1 year lock in period for its VIL shareholding and is free to sell the stake thereafter.

Why this solution will work

There are 5-6 major forces at play in this industry.

  1. The telecom sector in India is at the cusp of recovery. Demand for services like calls and internet data are booming. Prices for mobile services have been depressed, but are on a recovery since Jan 2020. Further recovery will ensure operating health of current providers. If VIL can survive the next 1 year, it has a good chance of becoming financially healthy.
  2. GoI will get its AGR dues over a period of time. By not demanding AGR dues immediately, VIL may be able to survive. In fact if VIL does well, then GoI may be able to collect more money than the current owed ₹50,399 cr. as the VIL market cap grows. It also helps if GoI starts solving outstanding disputes with industry faster.
  3. VIL should be able to service its debts from operating revenues. Thus banks and funding agencies do not have to declare this as NPA. This will avert a disaster.
  4. Customers would be able to continue with VIL without disruption. They may have to pay more, but India cannot stay the cheapest place in the world for mobile services forever.
  5. Vendors, employees and business partners of VIL can continue unaffected.
  6. Corporates in India will gain in confidence. Even Reliance Jio and Bharti Airtel should be happy about VIL’s survival. There is ample room for all players to grow.

We have a precedence

Just a few months ago, the RBI stepped in to save Yes Bank from collapse. In an admirable and swift action, the failing bank was recapitalised and the new stake ownership was spread over several PSBs and other investing institutions.

In a similar manner, perhaps more urgently than Yes Bank as this industry has just 4 players, VIL needs to be saved, and given a chance to not just survive but hopefully prosper.

DISCLAIMER

  • This document has been prepared by JainMatrix Investments Bangalore (JM), out of public interest. This is our opinion only and we have not communicated with Vodafone Idea, Reliance Industries, Bharti Airtel, TRAI, Dept of Telecom or SC or any other party directly to come to these conclusions.
  • Punit Jain discloses that he has no equity ownership or known financial interests in Vodafone Idea Ltd, Reliance Industries or Bharti Airtel or any group company, to the best of his knowledge. He has shares in Yes Bank since 2005. Punit Jain does have a VIL mobile service subscription since over 10 years.
  • This report is for information purposes of recipients and not to be used for circulation.  This report should not be considered or taken as an offer to sell or a solicitation to buy or sell any security. The information contained in this report has been obtained from sources that are considered to be reliable. However, JM has not independently verified the accuracy or completeness of the same. Neither JM nor any of its affiliates, its directors or its employees accepts any responsibility of whatsoever nature for the information, statements and opinion given, made available or expressed herein or for any omission therein. Recipients of this report should be aware that past performance is not necessarily a guide to future performance and value of investments can go down as well. The suitability or otherwise of any investments will depend upon the recipient’s particular circumstances and, in case of doubt, advice should be sought from an Investment Advisor. Punit Jain is a registered Research Analyst under SEBI (Research Analysts) Regulations, 2014. JM has been publishing equity research reports since Nov 2012. Any questions should be directed to the director of JainMatrix Investments at punit.jain@jainmatrix.com.