- Date: 1st Aug 2016
- IPO Period: 1st – 3rd Aug, IPO Price range: Rs. 214-219
- Mid Cap: Rs 2,995 crore Mkt cap
- Industry – Roads Construction EPC
- Advice: The DBL IPO is an AVOID
Summary
- Overview: DBL is a construction firm undertaking projects in the roads and irrigation sectors like national and state highways, city roads, culverts and bridges.
- DBL had revenues and profits of Rs 4,315 crores and Rs 197 cr. resp. in FY16. Its revenue, EBITDA and PAT have grown 58.1%, 61.0% and 38.1% CAGR over 6 years.
- DBL has a policy of no subcontracting and no equipment on rental. It owns the equipment fleet of 7,345 vehicles and is a large employer with 19,746 employees. In this sector Dilip Buildcon has built a good momentum of business, and is growing from an MP centric firm to an all India operating entity. It has good policies and business model. It has a 3.9% market share in its industry.
- Valuations, with a PE of 15.2 times, look expensive compared to quality peers such as IRB.
- Sector specific challenges like cash flows, debt, litigation and regulatory issues worry us. The roads construction sector by its very nature currently offers very few attractive opportunities. Investors need to look at profitable / high certainty sectors other than real estate.
- Outlook: As an investment, we recommend an AVOID on DBL IPO.
Here is a note on Dilip Buildcon Ltd (DBL).
IPO highlights
- IPO opens: Monday 1-3rd August 2016 with Issue Price band: Rs. 214-219 per share.
- Shares offered to public: 2.99 crores of Face Value: Rs. 10 / share, Market Lot is multiples of 65.
- Shares offered are 21.8% of post IPO equity. The offer is of Rs 654 cr. (upper band) which is a sale by current shareholders (Rs 224 cr.) and fresh issue of shares (Rs 430 cr.)
- The promoters of DBL are Dilip & Seema Suryavanshi and Devendra Jain who holds 90.25% stake, (post IPO 75.6%). PE fund Banyan Tree Growth Capital holds 9.75% (post IPO 2.53%).
- The shares quotas to QIB, NIB and retail are of 50:15:35. Objects of the issue – repayment of term loans (Rs 202 cr.); working cap. funds (Rs 200 cr.) and general corp. purposes (Rs 252 cr.)
- Post IPO holding % are Promoter 75.6, Banyan Tree GC 2.5, IPO -QIB 10.9, NIB 3.4, retail 7.6%
- The IPO grey market premium on DBL is Rs 17-19, a positive indication (on 29th July).
Introduction
- DBL is an EPC firm into construction projects for roads, irrigation and commercial buildings.
- DBL had revenues and profits of Rs 4,315 crores and Rs 197 cr. resp. in FY16. Its revenue, EBITDA and PAT have grown 58.1%, 61.0% and 38.1% CAGR over 6 years.
- DBL owns a fleet of 7,345 vehicles and other construction equipment. DBL is one of the largest employers in construction in India with 19,746 employees in FY16.
- DBL’s business comprises of: (i) construction business, where they undertake roads, irrigation and urban development projects on an EPC basis; and (ii) infrastructure business, under which they undertake road projects on a BOT basis with a focus on annuity projects. See Fig 1.
- For FY16 govt. contracts accounted for 76.3% and private contracts 23.7% of the order book.

Fig 1 – Revenues by Vertical/Fig 2 – State wise order book for FY16 (click to enlarge images)
- Mr. Dilip Suryavanshi is the CMD. He has 32 years’ experience in construction, and is President of the MP Builders Association. Devendra Jain is the CEO & ED of DBL has 17 years’ experience in construction. Prior to joining DBL, he was an assistant professor.
- The DBL Directors pay is detailed in Exhibit 3.
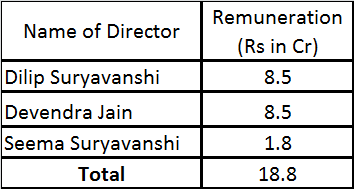
Exhibit 3 – Director Remuneration in FY16
- DBL’s marketing and business development for construction are carried out centrally in Bhopal, MP. DBL is currently pre-qualified to bid for BOT projects with a contract price up to Rs 2,140 cr. and EPC projects with a contract price up to Rs 1,253 cr. The pre-qualification has helped increase their target market size and maintain the order book growth.
- As of FY16 end, DBL had an order book of Rs 10,778 cr., consisting of 50 third party road EPC projects – 6 own road BOT, 3 irrigation, 1 mining, 1 cable-stayed bridge and 3 urban development. The construction order book was 84.6% of total in FY16. Also see state wise break-up in Fig 2.
- In the last 5 years, DBL has completed 47 road projects in MP, Gujarat, HP, Rajasthan and Maharashtra, with an aggregate length of 5,612 lane km.
Business Model, News and Updates for DBL
- DBL has a policy of no subcontracting and no equipment on rental. This has helped it build in house human resource capabilities as well as own and maintain capital equipment.
- DBL carefully selects projects and strives for geographical clustering of these outside MP. This helps in utilization of construction assets and reduce environmental and forest clearance risks. It also paves the way for regional strengths. DBL leverages its manpower, equipment and materials and saves transportation costs, thus achieving economies of scale.
- DBL has a good record for projects completed on time. DBL received early completion bonuses of Rs 192 cr. for 11 of its BOT projects and Rs 28.6 cr. for 10 govt. EPC projects over the last 5 years.
- DBL won a contract to build India’s second largest cable bridge on Zuari river in Goa.
- DBL is targeting to realize around Rs 11,000 cr. revenue by FY18.
- In June 2012 Income Tax dept. conducted raids on promoter Dilip Suryavanshi, teacher-turned local business tycoon Sudhir Sharma and associates at 10 locations, including Indore and Bhopal in MP. The IT officers found incriminating documents related to tax evasion that were seized. The ED later sought details from the IT dept. regarding an alleged Rs 140 cr. FEMA violation from South Africa. (TOI news).
- DBL on 29th July raised ₹196 crore from anchor investors ahead of the IPO. It allotted 89.6 lakh shares at ₹219 apiece to 10 anchor investors. They include SmallCap World Fund, American Funds Insurance Series, Abu Dhabi Investment Authority, Nomura Singapore, Grandeur Peak Emerging Markets, DB International (Asia), HDFC Trustees Company and IDFC Infrastructure Fund.
Roads Industry Outlook
- We are skeptical of the sector as it faces risks like high working capital, long project gestation, poor and expensive funding options, land acquisition issues, PIL & litigation pressures and many govt. clearances.
- The transport sector constitutes 6% of the country’s GDP and 70% of this is from roads. India has an extensive road network of 52.3 lakh km which is the 2nd largest in the world.
- Roads form the most common mode of transportation and are the main arteries for travelling across India. It is estimated that 60% of the freight and 85% of the passenger traffic is carried by roads.
- National highways (NH) which account for 2% of the total road network length in India, carry 40% of the road traffic volume. Additionally, state and major district roads carry another 40% of traffic volume and account for 20% of road length (adding up, the 80-20 rule applies).
- Under NDA rule, GoI has launched initiatives to upgrade and strengthen highways and expressways. The NHAI and the Ministry of Road Transport & Highways sanctioned projects for 2,337 km in FY16. An outlay of Rs 26,600 cr. was provided, and 6,300 km of NHs & 8 bypasses were to be completed.
- GoI aims to develop 57,653 km of National Highways under programs like NH Dev. Project (NHDP), Special Accelerated Road Dev. Program for NE (SARDP-NE) and NH Interconnect Improvement Project (NHIIP).
- In the BOT model private developers invest funds for constructing roads, and recover this through toll collection. However the BOT model has in 2010-15 faced high failure rates. To revive the sector, the new govt. reverted to the EPC model, where the road construction is funded by the govt. In Apr 2015 the govt. launched a hybrid annuity model where project costs are shared with developer in a 40:60 ratio. So govt. provides 40% of the project cost to start work while the rest of investment is from developer.
- IRB Infra Ltd and Sterlite Power Grid are preparing to list their Infra Investment Trusts (InvITs). These Trusts hold income-generating infra assets, and offer regular yields and liquidity to developers. They may attract longer duration funds, allowing better asset – liability matching. InvITs are expected to encourage higher FDI in the infra sector, reduce the burden on bank funding and allow developers to unlock tied-up capital. This is a positive sign for the industry including Dilip Buildcon.
- Over the next 5 years, it is expected that NHAI would award more than 22,500 km of projects. With BOT projects losing favour, NHAI has been awarding more EPC and hybrid projects.
- It is expected that investments in road projects will grow 2X to Rs 8.6 lakh crores over the next 5 years. Investments in state roads are expected to grow steadily, while those in rural roads will rise at a slower pace, impacted by a drop in budgetary allocations and funding constraints. Source: RHP/CRISIL Research.
- As per IBEF (GoI), the Roads and Bridges construction sector size in 2016 was Rs 1,11,209 cr. So the market share of DBL in the sector is 3.9%.
Financials of DBL
- DBL’s revenue, EBITDA and PAT have grown 58.1%, 61.0% and 38.1% CAGR over 6 years.
- The revenues have grown steadily, however the margins of DBL are volatile. The years 2014-15 saw poor financials (the entire sector was underperforming). Most contracts awarded earlier faced implementation and cost & time overruns. See Fig 4.

Fig 4 – DBL financials

Fig 5 – DBL cash flows
- DBL paid a dividend of Rs 0.025/share (Rate of 0.25%) in FY16, a yield of 0.01% which is very small. Dividend has been paid for several years but the rates have been falling.
- DBL has been able to generate free cash flows only in FY16 of the last 6 years. DBL could be on a strong revival backed by govt. policy initiatives and growing order book size. Fig 6.
- The cash per share including Reserves & Surplus and Cash in Balance sheet is Rs 73/share (post IPO). This indicates that the current operations of DBL are available in IPO at (219-73) = Rs 146/share.
- DBL has a ROE of 19.6% in FY16 (source RHP) making it the industry leader. This is a positive.
- It has a booked to bill ratio of 2.5 (FY16) – is good and improving over 3-4 years, Fig 6.
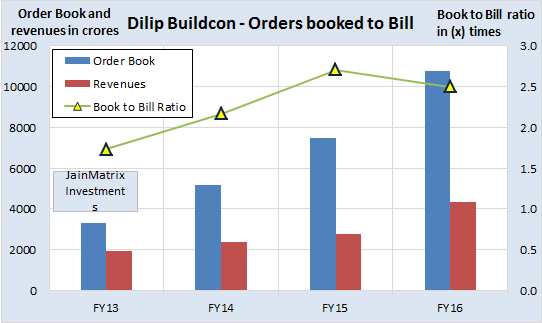
Fig 6 – Order book position
Benchmarking
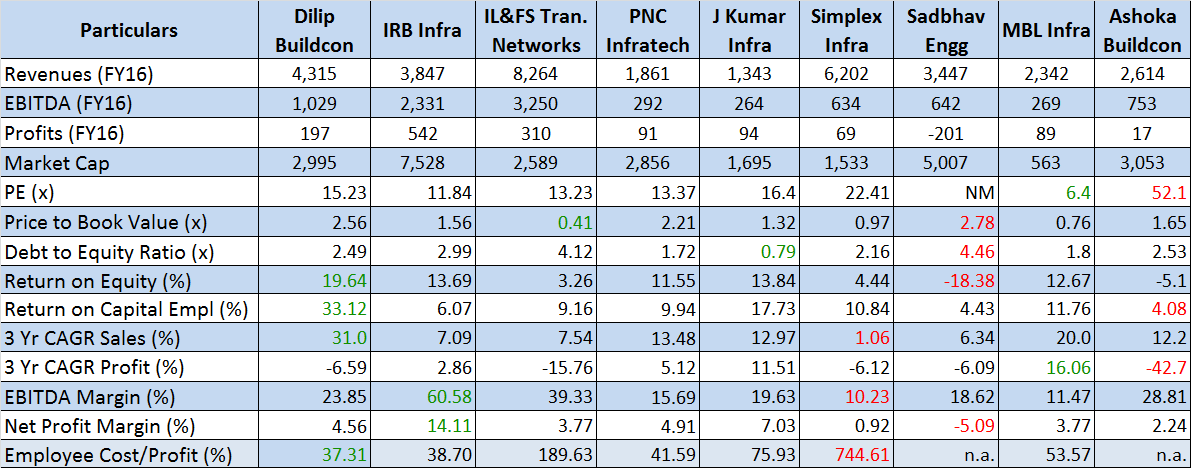
Fig 7 – Benchmarking (Click Image to enlarge)
We benchmark DBL against peer Infra companies like Ashoka Buildcon, IRB Infra, etc. See Fig 7.
- DBL appears to be available at slightly expensive valuations in terms of P/E and P/B.
- High RoE, RoCE and 3 year sales growth are positives.
- Employee costs are good in proportion to profits.
- D/E is moderate to high. Margins are average in line with other industry players.
Positives for Dilip Buildcon Ltd and the IPO
- DBL has a good presence in MP, its home state. Beyond MP, it operates in geographical clusters for projects which helps with efficiency and asset utilization. DBL has an efficient business model. The execution through strong operations helped DBL receive early completion bonuses for many projects.
- Large employee strength and construction assets. It also has a fine factory/ campus in Bhopal.
- Strong growth in financials and order book. Their O/B grew at 48.1% CAGR over 4 years.
- Promoters Dilip Suryavanshi and Devendra Jain have solid experience profiles.
Internal Risks
- The firm has a business concentration in MP with 40% of the O/B coming from there Fig 2.
- All firms in the sector faces business risks like high working capital requirement, long project gestation periods, govt. clearances and PIL/ litigation issues. DBL is no exception.
- We worry about allegations of political connections in MP and the litigations listed in the RHP. While we understand that in a business such as infra development, there are always going to be legal, law and order and regulatory challenges, but DBL appears to having an excessive number of such issues.
- The 2012 IT Department case of tax evasion and FEMA is an issue. While the firm is attempting to settle this issue, there is no clarity on addl. tax liabilities, or even more such cases against the firm.
- The top 3 promoters were paid high salaries – 10% of FY16 profits. This is not shareholder friendly.
- DBL has an accounts receivable period of 108 days, higher than industry average of 80-90 days. This is partly because the govt. is the major customer.
- A promoter has pledged 54.1 lakh equity shares, 4% of the post IPO share capital, to raise funds. We understand this is a norm in Real Estate/ construction sectors. But its a negative.
- DBL’s revenues from projects are unpredictable and subject to seasonal variations. However the firm records revenues using % completion method and revenues are not recognized until there is reasonable progress on a contract. This is a good/ conservative method.
External Risks
- A political regime change in MP may affect their current projects and orders booked pipeline.
- Competition is intense in road projects, particularly in EPC projects rather than BOT.
- The Land acquisition Act in India specifies the process and compensation. It has undergone several changes recently, and we expect more changes. The uncertainty affects the roads EPC industry.
- BOT projects are evaluated based on traffic projections. In this sector, many BOT companies are facing financial pressures due to rosy projections during evaluation and high competition during bidding.
Overall Opinion
- There is an urgent need to upgrade Indian infrastructure such as roads and highways. This was reflected in the Feb 2016 Indian budget announcements. We can see that on one side highways have improved a lot in the last decade; at the same time most newly launched capacity is quickly at a high utilization!!
- There are signs of revival in old stuck projects as well as momentum in bidding for new ones.
- In this sector Dilip Buildcon has built a good growing business, and is expanding from an MP centric firm to an all India operating entity. It has good policies and business model.
- However valuations for DBL are expensive compared to higher quality peers such as IRB.
- Sector specific challenges like cash flows, debt, litigation, pledging and regulatory issues worry us. The roads construction sector by its very nature today offers very few attractive opportunities. Investors can look at profitable / high certainty sectors other than infra EPC.
- As an investment, we recommend an AVOID on DBL IPO.
JAINMATRIX KNOWLEDGE BASE
See other useful reports:
- IRB Infrastructure – May 2012 report
- Do you want to be a value investor?
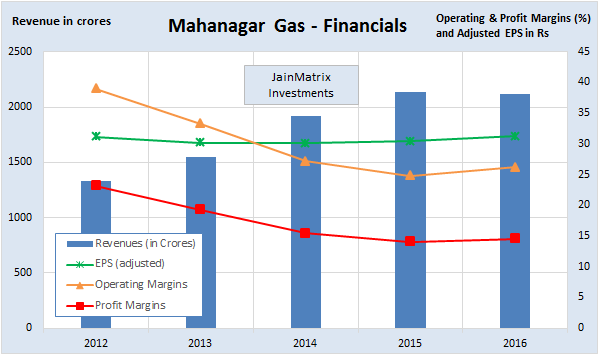
- Mahanagar Gas IPO
- How will Brexit impact Indian investors?
- A Repurpose for our PSUs
- How to Approach the Stock Market – A Lesson from Warren Buffet
- An IPO Roundup and Update
- JainMatrix Track Record May 3rd, 2016
- Thyrocare IPO – Wellness for your Wealth
- New Banks: Big Changes in Small Change
- Equitas IPO – Leader in SF Banks
- Announcement – SEBI approval as a Research Analyst
- Alkem Labs IPO
- Goods And Services Tax (GST): Integration And Efficiency
- Syngene IPO: Good Pharma R&D spinoff from Biocon
- Visit and Like JainMatrix FB or Follow on JainMatrix Twitter for reports
DO YOU FIND THIS SITE USEFUL?
- Visit the Investment Service page to find how you can get more. Or Click LINK.
- Register Now to get our Free reports and much more, on the top right of this page, or by filling this Signup Form CLICK.
Disclaimer
This document has been prepared by JainMatrix Investments Bangalore (JM), and is meant for use by the recipient only as information and is not for circulation. This document is not to be reported or copied or made available to others without prior permission of JM. It should not be considered or taken as an offer to sell or a solicitation to buy or sell any security. The information contained in this report has been obtained from sources that are considered to be reliable. However, JM has not independently verified the accuracy or completeness of the same. JM has no known financial interests in Dilip Buildcon or any related group. Neither JM nor any of its affiliates, its directors or its employees accepts any responsibility of whatsoever nature for the information, statements and opinion given, made available or expressed herein or for any omission therein. Recipients of this report should be aware that past performance is not necessarily a guide to future performance and value of investments can go down as well. The suitability or otherwise of any investments will depend upon the recipient’s particular circumstances and, in case of doubt, advice should be sought from an Investment Advisor. Punit Jain is a registered Research Analyst under SEBI (Research Analysts) Regulations, 2014. JM has been publishing equity research reports since Nov 2012. Any questions should be directed to the director of JainMatrix Investments at punit.jain@jainmatrix.com.