——————————————————————————————————————–
- Date: Dec 11th, 2014
- CMP: 1095 and P/E: 41.5
- Mid Cap: with mkt cap 3200 cr.
- Industry: Consumer Electricals and equipment
- Advice: Downgraded to a Hold due to excessive valuations
We first published this for Subscribers on 10 Sept 2014. The share has appreciated 38% in 3 months. Sign up for the Investment Service to get the latest valuable reports.
- Visit the Investment Service page to find how you can get more. Or Click LINK
- Register Now to get our Free reports and much more, on the top right of this page, or by filling this Signup Form CLICK.
V-Guard is a small manufacturer of household electricals like voltage stabilizers, UPS, pumps, water heaters, cables, ceiling fans, etc. After success in South India, it is rolling out nationally. Strengths include strong brand, good R&D and smart manufacturing and sourcing operations. It’s a high demand sector, with growth prospects due to affluence and rising no. of households. Revenues, EBITDA, Profits and Share Price grew at 33%, 27%, 11% and 42% CAGR over last 7 years. The share has given 16X gains since March 2008. Risks include high valuations, national scaling challenges and crowded new product categories.
V-Guard Industries – Profile
- V-Guard Industries (VGI) is a Kerala based firm into electrical equipment for households.
- Revenues in FY14 were Rs 1,518 crores and profits Rs 70 cr. Market Cap is 3,200 cr.
- Started in 1977, with voltage stabilizers, it has expanded its product segments, see Fig 1.
- VGI has 1599 employees and a network of 407 distributors, 4,344 channel partners and 25,000 retailers across the country. It has factories in Coimbatore and Perundurai (TN), Kashipur (Uttarakhand), and Kala Amb (HP), but VGI also has a smart outsourcing strategy for production.
- Key Executives are: Kochouseph Chittilappilly (Chairman), Mithun Chittilappilly (MD) and V. Ramachandran (Director Marketing & Strategy).
- Shareholding pattern % is: Promoters 66.2, FI/FII 19.0, Individuals & HNI 9.3, MFs 4.1 and Others 1.4.
- The successful IPO of Wonderla Holidays, a sister company is a feather in the cap of this group.

Fig 1 – V-Guard Products (click image to expand)
Product Notes
The product range is depicted by Fig 1, while the product revenues of FY14 are in Fig 2.
- House Wiring Cables: This is the largest product segment of VGI. The demand in the market is high and the firm is going ahead with a capacity expansion at the Kashipur Plant.
- Voltage Stabilizers: This is VGI’s flagship product and continues to be one of the largest contributors to revenue and profitability of the Company. Revenues are directly related to white goods sector.
- Pumps and Motors: This is one of the established segments for VGI contributing to major parts of sales. VGI continues to enjoy premium pricing over competition in the Southern markets.
- Digital UPS: The digital UPS segment has been the fastest growing segment for VGI. Increased brand penetration for the product, coupled with the frequent power outages in most parts of the country has driven the growth for this segment.
- Fans: VGI launched fans in 2006 and has more than 30 models with variants of ceiling, pedestal, table, wall, ventilating and exhaust fans. The overall fan market is expected to witness sharp expansion going forward on the back of strong expected growth in the housing sector.

Fig 2 – V-Guard Product Revenues
- Other revenue segments of VGI business constitutes of LT Cables, Electric Water Heaters, Solar Water Heaters, Desktop UPS, domestic switch gears and induction cookers.
- VGI has built its presence in the kitchen appliance category by launching mixer grinder (in 2014) and induction cooker (2013), and both have been well accepted in the market. The launch of Pebble, its new range of water heaters, was successful. It also unveiled Enviro, a hi-speed pedestal fan.
Business Notes
- Management: The first generation entrepreneur Kochouseph Chittilappilly started this company from scratch in 1977. They later diversified into amusement parks, and Wonderla Holidays is now run by Arun Chittilappilly, his brother. His son Mithun joined VGI in 2004, and is now the MD. The Vice Chairman is Cherian N. Punnoose, an experienced CA and professional. The Director-Marketing & Strategy is V. Ramachandran, ex LG and HUL. Thus VGI may have stepped beyond a family business and has professionalized management, a necessary condition for stability and growth.
- Vision: The leadership has a vision to become No. 3 player in each category in the next 3-4 years.
- The VGI brand is strong, particularly in South/Kerala, and is now expanding all India. Fig 3.
- VGI has expanded beyond the initial success of voltage stabilizers into related UPS, then house wiring cables, pumps and motors and household devices like fans, water heaters, etc. Fig 1 and 2.

Fig 3 – Sales Distribution
- VGI owns two wind energy converters type E30 at Erode in Tamil Nadu with a capacity of 230 KW. Currently it produces 13 lakh units per annum, which is transferred to the state electricity grid.
- Manufacturing: Considering the strong demand for wires, VGI has decided to double the capacity at the Kashipur plant in Uttarakhand from 3.3 million coils per annum to 6.6 million coils per annum in two phases. The investment for this was Rs 18 cr. VGI’s new plant for producing solar water heaters at Perundurai TN has gone on stream in 2013, with annual capacity of 90,000 solar water heaters.
- It has an asset light model, and outsources more than 60% of its production.
- Operational improvements in FY14 included reduction in its working capital cycle (by 8 days to 76), improvement in inventory days by 8 days and debtor days by 2 days, generating good cash flows.
- R&D: VGI’s R&D Centre in Kochi was certified by the central govt’s Dept. of Scientific and Industrial Research (DSIR). Good R&D has reduced power consumption and improved products continuously.
- VGI has recently won the ‘Innovative 100’ Awards 2013 hosted by Inc. India magazine, for the brand’s constant effort to bring in smart innovations in their product categories.
- Advertising: VGI spent around 58 cr. (4.3% of revenues) on advertising in FY13, then increased it marginally in FY14 to 60 cr. (3.9%). Most of the expenditure in FY14 was targeted at the IPL.
- Ad spends are to be maintained at 3.5-4% of revenues in FY15 as well.
Business Challenges:
- Competition: In recent few years VGI has faced competition from Honeywell Automation, Genus Power Infra and Pearl Electronics. BEL is the largest player in electronics components in India. Havells is a large player in house wiring cables and fan segments in Non South regions.
- Fans, heaters and kitchen appliances are established categories with organized and unorganized sector competition.
- Many of the products have a negative correlation to overall development. The core voltage stabilizers product is threatened by improved power delivery by electricity utilities. It is also challenged by fridges and ACs bought pre-fitted with stabilizers.
- Laptops and tablets too do not require UPS due to in-built chargeable batteries.
- Seasonality affects demand – pumps, motors and stabilizers depend on rainfall and power supply.
Stock Evaluation, Performance and Returns
- The price and dividend history (LINK) has shown a fine growth since it got listed in Mar’08.
- The share is currently at its all-time high range. Dividend too has grown steadily in the last 7 years.
- Revenues, EBITDA, Profits and Market Price grew at 33%, 27%, 11% and 49% CAGR over last 7 years.
- Profit appears low only due to a high base effect in FY08. See Fig 4.

Fig 4 – Quarterly Financials, by JainMatrix Investments
- Revenues growth has been excellent, while the operational and profit margins are flat. The EPS has surged due to the volumes growth.
- In addition, good operational decisions like more sourcing v/s in-house mfg have kept costs in check.
- The Free Cash Flow has been positive in only 2 of the last 7 years. Fig 5. However the operational Cash Flow has been positive for 4/7 years. Investments have been made into capacity expansion and factories. The recent years show FCF is much higher. This is positive.
- The historical average for PE of VGI is 20 times, and a range of 10-30 times over 7 years. See Fig 6.
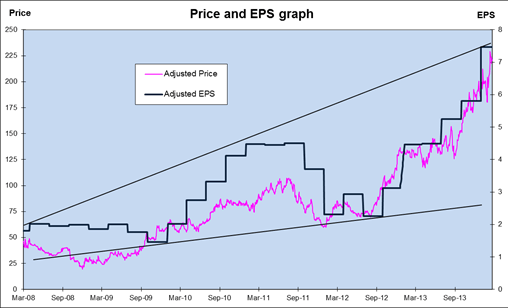
- The price chart shows an accelerating rise. The PE too is at 41.5 times, at all-time high levels. Thus it appears that VGI is overpriced at these levels.
- The EPS for VGI peaked in Mar ’13 but has crossed these levels in the Q2FY15. See Fig 7.

Fig 5 – Cash Flow and Dividend, by JainMatrix Investments

Fig 7/8 – Price, PE and EPS, by JainMatrix Investments
- ROCE and ROE are 26.1% and 24.2% respectively which is positive for the company.
- The D/E of the firm has fallen to 0.47 (Q2FY15) from 0.6 (FY13), a good improvement.
- Price to Book Value is at 10.3 (Q2FY15), which is high, but a sign of high insourcing of products.
- PEG is 1.96 times, indicating high valuations.
Do you find this site useful?
- Visit the Investment Service page to find how you can get more. Or Click LINK
- Register Now to get our Free reports and much more, on the top right of this page, or by filling this Signup Form CLICK.
Benchmarking and Financial Estimates
We present a benchmarking exercise with listed peers in similar product categories.

Fig 9 – Benchmarking, by JainMatrix Investments
- VGI has excellent growth, returns and D/E characteristics.
- Current Valuations are high, but overall VGI does fairly well in the comparison.
Financial Projections
We have carried out a financial projections exercise for VGI.

Fig 11 – Financial Projections, JainMatrix Investments
Risks and Challenges
- VGI has high brand recall in Kerala and Southern states. Future growth is dependent upon VGI being able to repeat and roll out its brand and distribution success nationally.
- Dependency on the seasons like rains and summer. Here variations are getting worse every year.
- Dependency on poor state electricity distribution for voltage fluctuations. This may improve slowly.
- High competition in newer product categories like kitchen appliances, fans, geysers, etc. In particular VGI has to stay away from well-established global categories like computers, audio and audiovisual.
- Volatility in raw material prices could impact margins in case cost escalations cannot be passed on to consumers.
Overall Opinion, Outlook and Recommendation
- Strong brand that can be well leveraged for new products in South and all products in Non South.
- Management that has grown businesses with good ambition, corporate governance and shareholder rewards.
- Demand drivers for VGI include India’s rising population & affluence and the switching of consumers from unorganized sector to VGI products. These trends should drive demand for VGI products, even as competition in these categories intensifies.
- The growing housing /real estate market can boost overall demand. Massive growth opportunities exist across household electrical and semi-electronic gadgets and equipment.
- Robust distribution and dealer network setup in South that is being replicated across the country.
- However at a PE of 41.5, PEG of 1.96 times and PB of 10.3 times, we feel valuations are stretched.
- VGI is a Hold today due to excessive valuations.
JainMatrix Knowledge Base:
See other useful reports
- Monte Carlo IPO
- Motherson Sumi Systems
- VST Tillers Tractors – Agro Growth
- Balkrishna Industries – The Tyres Roll Faster
- Tata Motors – A Jaguar like leap
- Large-Cap Portfolio Investment Note
- Mid-Cap Portfolio – Come, Invest in India
Do you find this site useful?
- Visit the Investment Service page to find how you can get more. Or Click LINK
- Register Now to get our Free reports and much more, on the top right of this page, or by filling this Signup Form CLICK.
Disclosures and Disclaimer
- This document has been prepared by JainMatrix Investments Bangalore (JM), and is meant for use by the recipient only as information and is not for circulation.
- JM has been publishing equity research reports since Nov 2012.
- Punit Jain has been a long term investor in VGI since Oct 2014. Other than this JM and its promoters/ employees have no financial interest in VGI and no known material conflict of interest as on date of publication of this report.
- This document is not to be reported or copied or made available to others without prior permission of JM. It should not be considered or taken as an offer to sell or a solicitation to buy or sell any security.
- The information contained in this report has been obtained from sources that are considered to be reliable. However, JM has not independently verified the accuracy or completeness of the same.
- Neither JM nor any of its affiliates, its directors or its employees accepts any responsibility of whatsoever nature for the information, statements and opinion given, made available or expressed herein or for any omission therein.
- Recipients of this report should be aware that past performance is not necessarily a guide to future performance and value of investments can go down as well. The suitability or otherwise of any investments will depend upon the recipient’s particular circumstances and, in case of doubt, advice should be sought from an independent expert/advisor.
- Any questions should be directed to the director of JainMatrix Investments at jain@jainmatrix.com