CPSE ETF – Unlocking Value, Slowly

The CPSE ETF NFO was launched in March 2014, and JainMatrix Investments had evaluated this offer and rated it a BUY. See this report – LINK. See post NFO note – LINK. We now review this ETF for its performance so far and evaluate it as an investment today.

Summary

  • The ten CPSE ETF firms are well known, high dividend, asset rich Indian PSUs’.
  • Investors have got a return of 27% (absolute) and 18.8% (annualized) in 17 months.
  • The prospects of the ETF firms look good. The govt. is executing on long pending structural reforms such as oil prices decontrol, subsidy reduction, power sector refocus, etc. On the whole, the CPSE ETF firms are expected to perform well.
  • The 20% fall in the last 45 days gives investors an opportunity to enter at better value.
  • BUY the CPSE ETF with a minimum 1 year perspective.

Introduction

  • Date 14th Sep-2015
  • Mutual Fund Nature – Large and Mid Cap PSUs ETF
  • Issue Price – Rs 17.45 post discount for retail category (FV – Rs 10, Premium – Rs 7.45)
  • NAV – Rs 20.8
  • Advice: Buy

CPSE ETF Description

  • The Central Public Sector Enterprises ETF Index was started to help the GoI disinvestment.
  • The Fund Manager, Goldman Sachs listed the CPSE ETF in a New Fund Offer on 4th April 2014.
  • The ten firms included in this ETF are well known, high dividend, asset rich Indian PSUs’.
CPSE ETF, JainMatrix Investments

Fig 1 – Sector weights, JainMatrix Investments

CPSE ETF, JainMatrix Investments

Fig 2 – CPSE Performance, JainMatrix Investments

  • We can see from the Price history of CPSE ETF, Fig 2, that within 2 months of launch, it hit its high of Rs 27.95. It was steady at 24+ levels till early Aug 2015, but has fallen almost 20% to 20.8 today.

Performance Review and ETF Outlook

Now here is a look at the ETF performance since the NFO listing.

CPSE ETF, JainMatrix Investments

Fig 3 – Investment Performance , JainMatrix Investments

CPSE ETF, JainMatrix Investments

Fig 4 – CPSE Shares and Outlook, JainMatrix Investments

  • Investors have got a return of 27% (absolute) and 18.8% (annualized) on the ETF. Fig 3.
  • Being an ETF, this fund invests in and tracks a weighted average of share prices of the stocks listed in Fig 4. In addition, we capture the share price gains and dividend over 6.5 years.
  • JainMatrix Investments had pegged an expectation of 24% from this ETF for the first year. This was achieved, but in the last 2 months, the ETF NAV fell due to the to the Coal India, ONGC and GAIL shares fall.

Pros of ETF

  • The GoI is making efforts to energize these firms to achieve production & revenue targets that will achieve national objectives. This will benefits investors also.
  • Many of these firms own wonderful assets, the family silver of the Govt of India. These firms may also enjoy monopoly status, and may be the implementation arms for govt. initiatives.
  • We can see that the GoI is in the process of dismantling the Administered Price Mechanism in Oil & Gas, and allowing Coal India, ONGC, etc to truly work freely without govt constraints and subsidy systems. If this is done, the massive assets and value of these firms can be unlocked.
  • The CPSE ETF has a low management charge at 0.49% as the stocks and weightage is fixed.
  • The weighted average share price appreciation over last 6.5 years is 11.8% for the firms. See Fig 4. This of course can vary widely from year to year. Dividend yield for these stocks is 3.67%.
  • Tax benefits: Individual resident investors would gain from nil tax on Long term capital gains, which kicks in at 12 months for this equity oriented fund.

Cons of CPSE ETF 

  • The ETF is dominated by the Oil & Gas, Power and Coal sector, where we have seen in the last one year a rapid fall in global commodity prices. This has affected the ETF performance.
  • This fund is Oil & Gas heavy with a 60% weight. If one extends the description to Energy Sector with Coal, Power, Oil & Gas and related financing, it increases to 92%. This is a high sector risk.
  • The GoI is in the process of disinvestment in PSUs, including some of the CPSE firms. This typically lowers share prices in the short term, till this process is complete. There is also talk of a second CPSE fund.
  • Decontrol of prices in petrol /diesel sector has affected Oil E&P while benefiting OMC firms.
  • Power sector reforms are crucial for financial improvement and debt reduction. This has started, but even so the power sector financial firms may see uneven performance.
  • Most of these stocks are asset heavy and resource rich firms. Their performance depends upon revenue growth, which has slowed down in recent years.
  • Another sharp fall in global oil prices can again depress the CPSE ETF performance.

Overall Opinion

  • There should be a stabilization and recovery in the ETF from here basis the following:
    1. There has been a massive fall in Oil prices globally. However now, it does not appear that there will be a further sharp fall. Thus ONGC share should not fall much further.
    2. Coal India and GAIL disinvestments should be complete in the next 3 months.
  • The prospects of the ETF firms post the above events look good. The government is cleaning up on long pending issues with structural reforms such as oil prices decontrol, subsidy reduction, etc.
  • Coal India performance (with Railways support) has improved of late. They are tasked with utilization of massive coal deposits and good supply which will reduce the need to import coal and waste forex.
  • On the whole, the CPSE ETF firms are expected to perform well.
  • BUY the CPSE ETF with a minimum 1 year perspective.

DISCLAIMER

This document has been prepared by JainMatrix Investments Bangalore (JM), and is meant for use by the recipient only as information and is not for circulation. This document is not to be reported or copied or made available to others without prior permission of JM. It should not be considered or taken as an offer to sell or a solicitation to buy or sell any security. The information contained in this report has been obtained from sources that are considered to be reliable. However, JM has not independently verified the accuracy or completeness of the same. Punit Jain has a small retail investor holding in CPSE ETF since NFO. He also has small holdings in the firms CIL, IOCL and EIL mentioned in this report. Neither JM nor any of its affiliates, its directors or its employees accepts any responsibility of whatsoever nature for the information, statements and opinion given, made available or expressed herein or for any omission therein. Recipients of this report should be aware that past performance is not necessarily a guide to future performance and value of investments can go down as well. The suitability or otherwise of any investments will depend upon the recipient’s particular circumstances and, in case of doubt, advice should be sought from an independent expert/advisor. JM has been publishing equity research reports since Nov 2012. JM has applied for certification under SEBI (Research Analysts) Regulations, 2014. Any questions should be directed to the director of JainMatrix Investments at punit.jain@jainmatrix.com.

JainMatrix Knowledge Base:

See other useful reports

Visit and Like JainMatrix FB or Follow on JainMatrix Twitter for reports.

Check back on the website jainmatrix.com for updates.

Do you find this site useful?

  • Visit the Investment Service page to find how you can get more. Or Click LINK
  • Register Now to get our Free reports and much more, on the top right of this page, or by filling this Signup Form CLICK.

Bajaj Finance – August 2015

JainMatrix Investments has just published a report on Bajaj Finance. We’ve been tracking this stock since many years. See some of our older reports –

This share has provided 11X returns to shareholders over 5 years, to become one of the best wealth generator mid caps today. We saw this early, and analysed and reported on this. We set bold and aggressive targets in our reports that many readers found incredible. And what happened? The share actually outperformed even our targets !!

Logo

So why do you need this report from JainMatrix Investments? Because once again we are bold, aggressive and seeing things early. And high quality research pays for itself many times over.

This report is restricted to subscribers, so visit the Payments Page, become a subscriber to the Investment Service and claim your copy of this report.

Regards,

Punit Jain  Founder, JainMatrix Investments

Britannia Industries – A Premiumization Play in Foods

  • 23rd April 2015
  • CMP: Rs 2151
  • Large Cap – Mkt Cap 26,000 crores
  • Advice: BUY, with a target of Rs 3168, a 47.3% appreciation by Mar’17.

Summary

Britannia rides not just the consumption theme, but within that the large food segment and also commands a premium image. Britannia is a powerful brand in this space. As an organization, BIL has recovered completely from the poor performance in 2010. Under a new leadership it is reinventing itself across marketing as well as operations. After many good initiatives in biscuits, the focus is on the high potential dairy products. The market conditions have been challenging in 2014-15, but even so, BIL has performed excellently so far. We expect the demand to look up in the next few years, and BIL to be a multi-year outperformer for investors. Investors may buy the stock for a Mar’17 target of Rs 3168, a 47.3% appreciation.

This is an update of our Feb 2014 report on Britannia Industries – A Ready to Eat Investment. The share has appreciated 144% in the 14 months since this BUY recommendation. 

Britannia Industries – Description and Profile

  • Britannia Ind. (BIL) is a Bangalore based, bakery and dairy products firm, started in 1892.
  • Revenue in FY14 was Rs 6,912 crores and PAT 396 cr, a growth of 52.3% from FY13.
  • Revenues have grown 17% (CAGR) over the last 6 years. Market Cap is 25,300 cr., ranked 2nd in India in the food processing industry by market cap. It has about 2340 employees.
  • BIL operates in foods segments of (i) Bakery – biscuit, bread, cake & rusk and (ii) Dairy – milk, butter, cheese, ghee, dahi, milk-based ready to drink beverages & dairy whitener.
  • The biscuit market is worth 24,000 cr. and BIL has 27-30% market share in India. The dairy segment is much larger at 75,000 cr. but BIL has a very small share here.
  • The shareholding % is: Promoter 50.8, FII 19.5, Retail/HNI 17.2, DI-5.2, MFs 4 and Corporates 3.3%.
  • Key executives are: Chairman Nusli Wadia, Director Ness Wadia and MD Varun Berry.

The report can be downloaded – JainMatrix Investments_Britannia_Apr 2015.

 JainMatrix Knowledge Base:

See other useful reports

Disclosures and Disclaimer

This document has been prepared by JainMatrix Investments Bangalore (JM), and is meant for use by the recipient only as information and is not for circulation. This document is not to be reported or copied or made available to others without prior permission of JM. It should not be considered or taken as an offer to sell or a solicitation to buy or sell any security. The information contained in this report has been obtained from sources that are considered to be reliable. However, JM has not independently verified the accuracy or completeness of the same. Neither JM nor any of its affiliates, its directors or its employees accepts any responsibility of whatsoever nature for the information, statements and opinion given, made available or expressed herein or for any omission therein. Recipients of this report should be aware that past performance is not necessarily a guide to future performance and value of investments can go down as well. The suitability or otherwise of any investments will depend upon the recipient’s particular circumstances and, in case of doubt, advice should be sought from an independent expert/advisor. JM has been publishing equity research reports since Nov 2012. Punit Jain has been a long term investor in BIL since March 2014. Other than this JM and its promoters/ employees have no financial interest in BIL or their group companies, and no known material conflict of interest as on date of publication of this report. JM is voluntarily compliant with SEBI (Research Analysts) Regulations, 2014. Any questions should be directed to the director of JainMatrix Investments at punit.jain@jainmatrix.com

Page Industries – The Jockey Rides Too Fast

  • Date: 13 Jan 2015
  • CMP: Rs 11,766
  • Mid Cap – with Mkt Cap 13,020 crores
  • Advice:  HOLD now, and buy on dips

Overview:

Page Industries with the Jockey franchise in India is a pioneer of the premium innerwear market. It is extending the success in menswear to womens wear and active wear, and with the Speedo brand to swimwear. Their revenues, EBITDA and PAT have grown by 36%, 35% and 37% CAGR over 6 years. With investments in manufacturing and retail, we expect this success trajectory to continue.

Why is it a HOLD? 

  1. Page has a PE of 71.3 times, a PEG is 2.4 and a P/B of 45.4 times
  2. It has seen a 109% price appreciation in the last one year.
  3. It is a Quality business, but available today at excessive valuations.
  4. It’s a Hold but investors may Buy on Dips.

Description and Profile

  • Page Industries, located in Bangalore makes innerwear (Jockey) and swim/active wear (Speedo).
  • FY14 revenues were 1187 crores, and profits 154 cr. Set up in 1994, Page listed in Mar 2007.
  • They have over 16,000 employees and manufacturing in 17 locations in Karnataka.
  • Page has an exclusive license for mfg. & sale of the Jockey brand innerwear, sports and leisure- wear for men and women in India, Sri Lanka, Bangladesh, Nepal and UAE. The Speedo brand was launched last year for swimwear, water shorts, apparel, equipment & footwear in India.
  • Page has a strong pan-India distribution across 1,200 cities, with 400 distributors, 147 exclusive Jockey outlets and more than 25,000 retail outlets.
  • Speedo is available in 826+ stores across 70 cities including 5 exclusive brand outlets.
  • The India Jockey business recently became the largest franchise globally from 142 countries.
  • Management has Sunder Genomal as MD, Vedji Ticku as COO and Pius Thomas is ED-Fin.
  • Shareholders are: Promoters 51.8%, MFs/ DII 6.4%; FIIs 32.3%, Individuals 6.8% and others 2.7%.

Business Model, News and Industry Note

  • Page has pioneered the premium segment of the inner-wear garments in India with the Jockey brand. They started distributing through multi-brand outlets, improved the display standards and raised the profile of this segment of garments. Marketing expenses are high at 6% of sales.
  • Page has an installed capacity of 16.2 cr. pieces per annum, in 17 units spread over 1.7 Million sq. ft. in Karnataka (FY14). The company plans to increase its capacity by 42% by Dec 2015.
  • Even though the consumers may be affluent people across age groups, the core target consumer for Jockey in India is “children born during the economic liberalisation era of the 1990s”.
  • Page through its Jockey relationship has access to good technology and marketing collateral which it utilizes as per its needs.
  • Though men’s innerwear is the major contributor to sales, the share of women’s innerwear and other categories has been rising steadily.

Products by Revenue  Fig 1 – Products by Revenue

  • Personal experience: This analyst visited a Jockey exclusive outlet in Bangalore to gain first-hand experience. The store was impressive in terms of location, access and visibility. The bright and clear displays inside make personal browsing easy. Men handled the mens products and girls handled womens products in their section at the rear of the store. Smart layout indeed. The sales assistants were helpful, and responsive. I did end up buying more than I had planned for  :-)
  • Online presence: Page products are widely available through the popular ecommerce sites, but not sold on their own website. Here they have the catalogue on display but no purchase facility.

Industry

  • Garments: The Indian Textiles Industry accounts for 4% of GDP, 14% of industrial production; it directly employs 3.5 cr. people (highest after agriculture) and accounts for 17% of all exports.
  • The size of the domestic readymade apparel industry is expected to double within 5 years due to prosperity, better government policy, fashion and brand trends and consumer expectations.
  • Government Policy Support: The Indian government supports the textile industry by investment promoting schemes like TUFS (Technological Up gradation Fund Scheme) and SITP (Scheme for Integrated Textile Parks). Page too is investing in new capacities using TUFs loans.
  • Innerwear: The innerwear market in India is estimated at Rs 17,750 cr. (Technopak Consultancy). This is split among menswear 39% and women 61%. The unorganised segment is estimated to be 69% of the innerwear market. This indicates the potential for growth for companies like Page.
  • The innerwear market is expected it to grow 3 times in 10 years. Growth will be driven by rising discretionary spends, growing number of mid-high income households and rising urbanization.
  • Jockey is at the premium end of the innerwear market in India. Peers include international brands such as Levi’s, Fruit of the Loom, United Colors of Benetton, Lovable Lingerie, Triumph, Enamor and Tommy Hilfiger, as well as the more mass brands like Rupa, Lux and VIP.
  • In the organised space, Page has 20% market share in men’s innerwear (about 50% of Page’s revenues) and just 3% in the highly fragmented women’s innerwear segment.

Stock Evaluation, Performance and Returns

  • Page had its IPO in Mar 2007 at Rs 360. The issue was subscribed 1.44 times.
  • The price never fell below 241 in March’07, and instead has appreciated by 73% per year since IPO. This why this share is rated one of the best Indian wealth generators in recent times.
  • The share has gained 109% in 1 year. We need to assess if the share is currently overvalued.
  • The company’s Revenues, EBITDA and PAT have grown by 36%, 35% and 37% CAGR over 6 years.

The Price History is available on the LINK.

quarterly finance
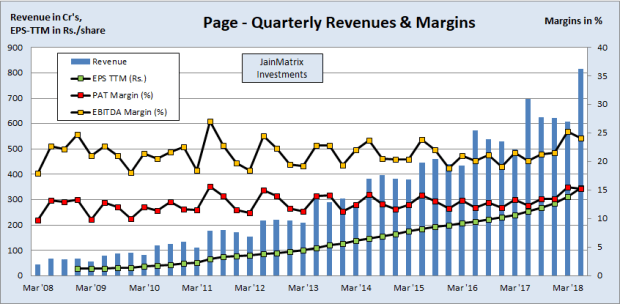
Fig 2 – Page Financials and Fig 3 Cash Flow, DividendCash Flow

  • In Fig 2 – Page Financials, we can see that Revenues and EPS have risen steadily. The surprise is that the Operating and Profit margins have not fallen even with a substantial rise in scale and business volumes. They have continued in the 18-25% and 10-15% range over a 6 year period.
  • The maiden dividend was paid in 2007. Thereafter dividend has shown a good increase, Fig 4. Dividend yield is currently at 0.51%,
  • Cash flow data Fig 3 shows that Page has been investing in its facilities & businesses. Even so, the operating cash flow has been good in the last 3 years, and net free cash flow is positive.

Price and PE

Price and EPS
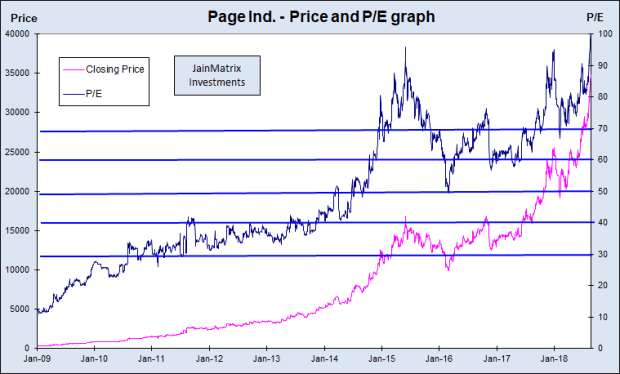
Fig 4 – Price and PE Chart, and Fig 5 – Price and EPS Chart

  • The Price and PE chart Fig 4 indicates that the historical average PE has been 35 times over 6 years. However the PE is clearly trending up indicating an exceptional situation – a significant business improvement, or a re-rating of the firm (or both).
  • At 71.3 times today, the PE is clearly among the highest in the Indian consumer industry. The only other names that come to mind are Jubilant Foodworks (91 times)
  • The Fig 5 – Price and EPS graph shows that EPS has been on a steep ascent. The share price has been roughly following the EPS.

Financial MetricsFig 6 – Finance Metrics

The Fig 6 displays some of the key financial ratios.

  • The company has a healthy interest coverage ratio. The Profit and Operating Margins are consistent over the years.
  • The firm has used its good cash flows to reduce debt, and the debt-equity ratio has been falling.
  • Page has an impressive and rising RoCE (59%) and RoNW (61.2%).
  • Page has not changed its equity capital in 7 years since listing, which is very good stability.
  • The beta of Page is 0.12 (Reuters). Thus it is far more stable than the market, which is very good.
  • PEG is 2.4 – indicates overvalued/expensive valuation, basis current PE and EPS projections.

Benchmarking and Financial Projections

A benchmarking exercise compares Page with peers in the apparel industry. See Table 7.

  • Page looks the most expensive but it also has the highest Sales and Profit growth, RoCE and RoE.
  • The dividend yield (%) is in the lines of the industry and is one of the better paced company.
  • Page is the leader in terms of returns. The company’s return on equity is overwhelming and hence, the stock is popular among the investors.
  • It is doing well on most of the parameters and is expected to continue on these lines in future.

Benchmarking and ProjectionsTable 7 – Benchmarking and Table 8 Projections

Risks

  • Entry of international brands + ecommerce. The ecommerce sector is booming in India and a number of high priced international brands are making their entry into the Indian market. By avoiding the retail route, they save costs and directly address the premium buyers.
  • Page has a good presence in multi-brand ecommerce websites and should compete strongly.
  • Increase in labour costs.
  • The company has taken steps to monitor and improve labour productivity and labour relations, which will mitigate the impact of increase in labour cost to large extent.
  • Increase in input and raw material costs.
  • The company is confident that the increase in input cost can be passed on to the consumers and moreover, there has been softening trend in the price of input material especially cotton.

Opinion, Outlook and Recommendation

  • The innerwear market in India is underpenetrated as compared to other Asian peers. Also favourable demographics and low penetration are strong growth factors.
  • Page has done pioneering work and is an innovator that has built the premium innerwear market in India, particularly in menswear. They have a robust brand, good marketing and retail practises and reputation for quality.
  • We expect Page to continue its rapid growth and repeat the success of means-wear in other segments such as womens-wear, swimwear, active/ sports-wear, etc.
  • Financially Page is well managed with good revenue and profits growth, strong balance sheet, good free cash flow, investments in capacity expansions and low debt.
  • However, a PE of 72 times, P/B of 45.4 times, an 109% price appreciation in the last one year and a PEG of 2.4 are indictors of over valuation. It is a Quality business, but at excessive valuations.
  • Page is a HOLD.

Disclaimer

This document has been prepared by JainMatrix Investments Bangalore (JM), and is meant for use by the recipient only as information and is not for circulation. This document is not to be reported or copied or made available to others without prior permission of JM. It should not be considered or taken as an offer to sell or a solicitation to buy or sell any security. The information contained in this report has been obtained from sources that are considered to be reliable. However, JM has not independently verified the accuracy or completeness of the same. Punit Jain has been a long term investor in Page Industries since June 2014. Other than this, JM and its promoters/ employees have no financial interest in Page and no known material conflict of interest as on date of publication of this report. Neither JM nor any of its affiliates, its directors or its employees accepts any responsibility of whatsoever nature for the information, statements and opinion given, made available or expressed herein or for any omission therein. Recipients of this report should be aware that past performance is not necessarily a guide to future performance and value of investments can go down as well. The suitability or otherwise of any investments will depend upon the recipient’s particular circumstances and, in case of doubt, advice should be sought from an Investment Advisor. Punit Jain is a registered Research Analyst under SEBI (Research Analysts) Regulations, 2014. JM has been publishing equity research reports since Nov 2012. Any questions should be directed to the director of JainMatrix Investments at punit.jain@jainmatrix.com.

To see latest price of Page Industries, click on // Page Industries

 JainMatrix Knowledge Base:

See other useful reports

  1. Godrej Properties – A Towering Success
  2. Happy New Year 2015 – the year of Focus and Concentration
  3. Top performing sectors in 2015 – An Interview
  4. MidCap Portfolio – Celebratory Outperformance
  5. V-Guard Industries – Electrifying Growth

Disclosures and Disclaimer

This document has been prepared by JainMatrix Investments Bangalore (JM), and is meant for use by the recipient only as information and is not for circulation. This document is not to be reported or copied or made available to others without prior permission of JM. It should not be considered or taken as an offer to sell or a solicitation to buy or sell any security. The information contained in this report has been obtained from sources that are considered to be reliable. However, JM has not independently verified the accuracy or completeness of the same. Punit Jain has been a long term investor in Page Industries since June 2014. Other than this, JM and its promoters/ employees have no financial interest in Page and no known material conflict of interest as on date of publication of this report. Neither JM nor any of its affiliates, its directors or its employees accepts any responsibility of whatsoever nature for the information, statements and opinion given, made available or expressed herein or for any omission therein. Recipients of this report should be aware that past performance is not necessarily a guide to future performance and value of investments can go down as well. The suitability or otherwise of any investments will depend upon the recipient’s particular circumstances and, in case of doubt, advice should be sought from an Investment Advisor. Punit Jain is a registered Research Analyst under SEBI (Research Analysts) Regulations, 2014. JM has been publishing equity research reports since Nov 2012. Any questions should be directed to the director of JainMatrix Investments at punit.jain@jainmatrix.com.

Godrej Consumer Products

———————————————————————————————-

Dear Investor,

JainMatrix Investments has published a research report on a LargeCap stock – Godrej Consumer Products.

Godrej Consumer Products, JainMatrix Investments

This is a Subscriber – only report.

But you are just 1 day away from getting the best direct equity portfolio in your email Inbox.  BUY NOW

See other useful reports made by JainMatrix Investments of firms from this sector

JainMatrix is Social

 Do you find this site useful?

  • Visit the Investment Servicepage to find how you can get more. Or Click LINK
  • Register Now to get our Free reports and much more, on the top right of this page, or by filling this Signup Form CLICK.

Godrej Properties – A Towering Success

——————————————————————————————————————–

  • Date: 12th Jan 2015
  • CMP: 253, PE: 28.4 times
  • Mid Cap with mkt cap 5,080 cr.
  • Advice: Medium Risk. Buy for minimum 2 year holding.

Overview:  GPL is a premium end player in housing, commercial and township real estate with a national footprint. It has a good record of projects, and a lean, asset light and productive business model. Revenues, EBITDA and Net Profit have grown by 37%, 25% and 16% CAGR over the last 6 years.

Why Buy Now: 1) The sector is emerging from some poor sentiment and is likely to benefit from economic revival. 2) GPL is a sector leader in terms of transparency, low debt and an asset light model. 3) There are signs of business acceleration at GPL which will be visible over the next two years. 4) GPL is currently at low historical valuations, and a likely mean reversion also points to a share appreciation

Godrej Properties – Description and Profile

  • Godrej Properties Limited (GPL) is a Mumbai based real estate firm and part of the Godrej Group.
  • Established in 1990, GPL had FY2014 revenues of Rs 1254 crore and profits Rs 154 cr.
  • It is developing residential, commercial and township projects across 9.3m sq.m. (100 m sqft.) in 12 cities.
  • Leaders are Adi Godrej (Chairman) and Pirojsha Godrej, MD & CEO.
  • It has 601 employees, an increase of 40% in FY14.
  • GPL has an asset light and capital efficient development model. It owns only 15% of the land it is developing, and partners with land owners by sharing in either revenues, profits or the constructed area, in a JV model.
  • In its commercial portfolio, it builds office space catering to blue-chip Indian and international companies and IT parks catering to the requirements of IT/ITES companies and retail space.
JainMatrix Investments

Fig 1 – GPL operations and Bookings, Source: GPL website (click on image to expand)

  • ICRA has upgraded long-term rating of GPL to AA- from A+.
  • Shareholding pattern in percentage is Promoter 75, MFs/DII 1.5, FIIs 11.5, Individuals 8.1, Corporates 3.1 and Others 0.8

Business Strategy

  • The GPL strategy is detailed in Fig 2, with which they have created a unique business model. Land ownership is mostly with partners, so operations are asset light.
  • GPL carries out project level equity dilution to mitigate risk and remain capital efficient.
  • Outsourcing of architecture and construction to good vendors ensures a lean structure and operations.
  • The strong Godrej brand is utilized and extended by GPL. The Corporate Governance is strong too.
Godrej Properties, JainMatrix Investments

Fig 2 – Business Strategy, Source: GPL website

  • The CII – Sohrabji Godrej Green Business Centre (a group company) has expertise in offering advisory services to the industry in the areas of green buildings, energy efficiency, water management, environment management, renewable energy, green business incubation and climate change activities.
  • GPL is also tasked with developing the large land bank of the Godrej group. They are among the biggest land owners in Mumbai.

Recent Events and Awards

  • GPL’s blended average selling price of real estate all India in Q4FY14 was Rs 8000 psf.
  • Business acceleration: GPL has started 18 projects in the last 10 quarters with 23.8m sqft. saleable area. In Q4FY14, it saw the highest ever sales in a single quarter – of over Rs 1,000 cr. Further, GPL may launch 15-16 residential projects in FY15, a good acceleration.
  • GPL successfully concluded a rights issue in Aug 2013 to raise Rs 700 cr. It issued 8 shares for every 29 shares held by shareholders at Rs 325 apiece, a discount of about 30% to the then market price.
  • GPL is the first real estate company in India to have ISO certification.
  • They have received over 50 awards received in the past 5 years. The Godrej Garden City project of GPL is one of only two projects in India and 16 worldwide to be chosen by The Clinton Foundation to partner with them in the goal of achieving climate positive development.
  • Great Places To Work – GPL was ranked 1st in the Real Estate and Construction sector in 2014; Ranked amongst top 25 companies to work for in India for the second consecutive year in 2014; The Aon Hewitt Employee Engagement Study measured that the GPL employee engagement score increased to 81% in 2013, from 79% in 2012 and 67% in 2011.
  • GPL has entered into an agreement with a land owner to develop an affordable housing project at Badlapur, near Mumbai. The project will have 1.3 million sq ft of saleable area.

Industry Notes

  • Real estate sector plays a crucial role in the Indian economy, contributing to 5-6% of the country’s Gross Domestic Product (GDP). It is the second largest employment generating sector after agriculture.
  • Apart from generating direct employment it also stimulates the demand in over 250 ancillary industries such as cement, steel, paint, brick, building materials, furniture, consumer durables, fittings, etc.
  • Rapid urbanization, positive demographics, growing nuclear families, infrastructure development, rising income levels and growing housing demand so far have driven real estate development in India.
  • There will be a shortage of 7.55 cr. residential units by 2014 end (CRISIL). Commercial demand is highly correlated to the GDP of the country, with recent falls in growth adversely affecting demand.
  • In current Industry scenario, the decline in demand is due to deteriorating macro-economic factors such as increasing prices, and recent regulatory changes (pertaining to development control rules), have led to prolonged period of lull for the sector.
  • Despite these headwinds, the $70-75 billion Indian real estate market size is expected to touch $180 b by 2020, while FDI in the sector is expected to increase to $25 b in 10 years from present $4 b.
  • GPL is fourth ranked of 26 listed Real Estate – Construction & Contracting firms (on NSE) by market cap. Further, its market cap gives it a 5% share of this universe. (Note – this does not include Civil and Housing focused Construction and Contracting firms, and also unlisted firms).
  • Budget 2014: the govt. announced relaxed norms for FDI in real estate, which will give a huge boost to housing projects. The Centre eased criteria for FDI by reducing the minimum size of projects from 50k sq. m. to 20k sq. m. and investment in projects from US$ 10m to US$ 5m (Rs 30 cr.)
  • The budget also allowed (tax) pass-through status to real estate investment trusts (REITs). REITs allow small investors to own a share in big expensive commercial properties. This is expected to drive substantial investment demand into commercial property.
  • The industry is overall poorly regulated and there are few norms around housing project launch, sale and execution by developers. Bank funding for developers has been a challenge, due to poor loans performance (by the sector) in the past. Hence debt costs are higher for developers.
  • The Real Estate Regulation and Development Bill, 2013 aims to bring in a high level of transparency in real estate transactions and projects in India. It proposes setting up a Real Estate regulator to cover commercial and residential real estate segment. It is being piloted by the ministry of GoI.

Stock Valuation, Performance and Returns

JainMatrix Investments, Godrej Properties

Fig 3 – Pricing History

  • Pricing history – Since the IPO in Jan 2010 at Rs 245 (adjusted for a split), the share price of GPL rose to a peak of 393 in July 2011. It then fell to a bottom of 154 in Jan 2014, helped along by a rights issue in Aug 2013 and share split in Nov 2013, before rising sharply to today’s CMP of 253. See Fig 3.
  • Investor returns for the IPO investors is +1.0% of IRR over 5 years. However IPO investors who added shares in the Rights issue of 2013 have a slightly better IRR.
  • But the GPL financials show a fine growth with Revenues, EBITDA and Net Profit growing by 37%, 25% and 16% CAGR over the last 6 years. EPS has also grown by 17% in this period. This lower growth is explained by the dilutions and capital raising undertaken to fund the growth. See Fig 4.
  • Annual revenues peak in Q4. As volumes increased, the Operating margin has shown a dip. But even as the EPS has increased, the Debt / Equity ratio has been in control, even improving.
JainMatrix Investments

Fig 4 – Quarterly Financials

JainMatrix Investments

Fig 5 – Cash Flow and Financial Ratios

  • FCF (Free Cash Flows) has mostly been negative except in the FY13. See Fig 5. This business definitely needs cash up front and is a long gestation projects business.
  • The Price and PE Chart Fig 6, shows that the PE has historically been in a range of 25-65 times over the last 6 years. This area can be broken into 4 quartiles.
  • Today the valuations for GPL are attractive as the PE is in the lowest quartile. The PE (TTM) is 28.4 times.
JainMatrix Investments

Fig 6 – Price and PE Chart

JainMatrix Investments

Fig 7 – Price and EPS Chart

  • Price and EPS chart Fig 7, shows that inspite of some volatility in EPS, the overall trend is a rising channel with some recent acceleration.
  • The Orders Booked to Billings ratio has stayed over 2, indicating a good pipeline of Orders. Fig 8.
  • The Beta of GPL is 0.86 which shows the low volatility as compared to the indices (Reuters).
  • The company has an interest coverage ratio of around 65 times which is good.
  • ROCE and RONW are in 7.7 and 9.9 respectively, which is an average level.
  • PEG is at 1.2 – indicates it is currently fairly valued.
JainMatrix Investments

Fig 8 – Orders Booked to Billings

Peer Benchmarking and Financial Projections

Here is a benchmarking exercise of GPL with its peer companies DLF, Oberoi Realty and NBCC.

  • The PE comparison indicates relative undervaluation. The Price To Book value however is high, as its book value is low due to the asset light model.
  • GPL is also higher in terms of 3 years CAGR sales, 3 years CAGR Profit and ROE among its listed peers, which is a positive sign.
  • NBCC shows some good metrics but signs of being overvalued.
Fig 9, 10 – Peer Benchmarking and Financial projections

Fig 9, 10 – Peer Benchmarking and Financial projections

We have projected the 2 year financials for GPL.

Risks:

  • Sector risk: The Real Estate industry in India is a high risk sector due to poor land records, opaque land use conversion rules and process, and multiple development approval requirements. GPL has however reduced these risks by an asset light partnering approach.
  • Business Model risk: There is high volatility in funding and cash flows for GPL. Real Estate project investments are front ended, while revenues are back ended for the 2-4 year project life cycle. Risks here include cash flow challenges, project funding availability and high cost of unsold inventory.
  • Economy risk: Demand is dependent on GDP growth, but the economy has slowed over 3-4 years.
  • Outsourcing risk: By outsourcing the construction activities, the final product quality depends upon the vendors. Thus vendor execution standards & consistency (risk) needs constant monitoring.
  • Regulatory risk: The central government is making attempts to govern, monitor and regulate the real estate sector for project transparency, public launch requirements, complaint monitoring, delays, etc. Any new rules, regulations and compliance requirements will affect the business of GPL.
  • Competition is intense, particularly in high end residential real estate sector.

Opinion, Outlook and Recommendation

  • There will continue to be a shortage of housing from a 10 year perspective. The regulatory environment for this sector will improve over the next 2-3 years, as the new government at the center brings in reforms and improves the ease of doing business. The economic cycle in India too is recovering from a bottom of 4.6% GDP growth recently. This will have a positive effect on GPL.
  • GPL is expanding its execution capabilities and brand strength in an all India manner, by both exploiting the land assets of the Godrej group, as well as partnering with land owners for projects.
  • The asset light, and partnering with the best vendors, approach is proving to be a good strategy.
  • GPL is in the midst of a business acceleration that will be seen over the next 2-3 years.
  • GPL is a BUY. Invest now and systematically to gain from long-term outperformance.

JainMatrix Knowledge Base:

See other useful reports

Visit and Like on  Facebook or Follow on Twitter for reports

Check back on this website for updates.

Do you find this site useful?

  • Visit the Investment Service page to find how you can get more. Or Click LINK
  • Register Now to get our Free reports and much more, on the top right of this page, or by filling this Signup Form CLICK.

Disclaimer:

This document has been prepared by JainMatrix Investments Bangalore (JM), and is meant for use by the recipient only as information and is not for circulation. This document is not to be reported or copied or made available to others without prior permission of JM. It should not be considered or taken as an offer to sell or a solicitation to buy or sell any security. The information contained in this report has been obtained from sources that are considered to be reliable. However, JM has not independently verified the accuracy or completeness of the same. Neither JM nor any of its affiliates, its directors or its employees accepts any responsibility of whatsoever nature for the information, statements and opinion given, made available or expressed herein or for any omission therein. Recipients of this report should be aware that past performance is not necessarily a guide to future performance and value of investments can go down as well. The suitability or otherwise of any investments will depend upon the recipient’s particular circumstances and, in case of doubt, advice should be sought from an independent Financial Expert/Advisor. Either JM or its affiliates or its directors or its employees or its representatives or its clients or their relatives may have position(s), make market, act as principal or engage in transactions of securities of companies referred to in this report and they may have used the research material prior to publication. It is safe to assume that if the JainMatrix website recommends a stock, the researcher has already invested in it. Punit Jain has owned (long only) GPL since Mar 2014. JM and employees do not seek or receive remuneration in any form for any service from the firms researched. Any questions should be directed to the director of JainMatrix Investments at punit.jain@jainmatrix.com.

V-Guard Industries – Electrifying Growth

——————————————————————————————————————–

  • Date: Dec 11th, 2014
  • CMP: 1095 and P/E: 41.5
  • Mid Cap: with mkt cap 3200 cr.
  • Industry: Consumer Electricals and equipment
  • Advice: Downgraded to a Hold due to excessive valuations

We first published this for Subscribers on 10 Sept 2014. The share has appreciated 38% in 3 months. Sign up for the Investment Service to get the latest valuable reports. 

  • Visit the Investment Service page to find how you can get more. Or Click LINK
  • Register Now to get our Free reports and much more, on the top right of this page, or by filling this Signup Form CLICK.

V-Guard is a small manufacturer of household electricals like voltage stabilizers, UPS, pumps, water heaters, cables, ceiling fans, etc. After success in South India, it is rolling out nationally. Strengths include strong brand, good R&D and smart manufacturing and sourcing operations. It’s a high demand sector, with growth prospects due to affluence and rising no. of households. Revenues, EBITDA, Profits and Share Price grew at 33%, 27%, 11% and 42% CAGR over last 7 years. The share has given 16X gains since March 2008. Risks include high valuations, national scaling challenges and crowded new product categories.

V-Guard Industries – Profile

  • V-Guard Industries (VGI) is a Kerala based firm into electrical equipment for households.
  • Revenues in FY14 were Rs 1,518 crores and profits Rs 70 cr. Market Cap is 3,200 cr.
  • Started in 1977, with voltage stabilizers, it has expanded its product segments, see Fig 1.
  • VGI has 1599 employees and a network of 407 distributors, 4,344 channel partners and 25,000 retailers across the country. It has factories in Coimbatore and Perundurai (TN), Kashipur (Uttarakhand), and Kala Amb (HP), but VGI also has a smart outsourcing strategy for production.
  • Key Executives are: Kochouseph Chittilappilly (Chairman), Mithun Chittilappilly (MD) and V. Ramachandran (Director Marketing & Strategy).
  • Shareholding pattern % is: Promoters 66.2, FI/FII 19.0, Individuals & HNI 9.3, MFs 4.1 and Others 1.4.
  • The successful IPO of Wonderla Holidays, a sister company is a feather in the cap of this group.
VGuard Products, JainMatrix Investments

Fig 1 – V-Guard Products (click image to expand)

Product Notes

The product range is depicted by Fig 1, while the product revenues of FY14 are in Fig 2.

  • House Wiring Cables: This is the largest product segment of VGI. The demand in the market is high and the firm is going ahead with a capacity expansion at the Kashipur Plant.
  • Voltage Stabilizers: This is VGI’s flagship product and continues to be one of the largest contributors to revenue and profitability of the Company. Revenues are directly related to white goods sector.
  • Pumps and Motors: This is one of the established segments for VGI contributing to major parts of sales. VGI continues to enjoy premium pricing over competition in the Southern markets.
  • Digital UPS: The digital UPS segment has been the fastest growing segment for VGI. Increased brand penetration for the product, coupled with the frequent power outages in most parts of the country has driven the growth for this segment.
  • Fans: VGI launched fans in 2006 and has more than 30 models with variants of ceiling, pedestal, table, wall, ventilating and exhaust fans. The overall fan market is expected to witness sharp expansion going forward on the back of strong expected growth in the housing sector.
V-Guard Product Revenues, JainMatrix Investments

Fig 2 – V-Guard Product Revenues

  • Other revenue segments of VGI business constitutes of LT Cables, Electric Water Heaters, Solar Water Heaters, Desktop UPS, domestic switch gears and induction cookers.
  • VGI has built its presence in the kitchen appliance category by launching mixer grinder (in 2014) and induction cooker (2013), and both have been well accepted in the market. The launch of Pebble, its new range of water heaters, was successful. It also unveiled Enviro, a hi-speed pedestal fan.

Business Notes

  • Management: The first generation entrepreneur Kochouseph Chittilappilly started this company from scratch in 1977. They later diversified into amusement parks, and Wonderla Holidays is now run by Arun Chittilappilly, his brother. His son Mithun joined VGI in 2004, and is now the MD. The Vice Chairman is Cherian N. Punnoose, an experienced CA and professional. The Director-Marketing & Strategy is V. Ramachandran, ex LG and HUL. Thus VGI may have stepped beyond a family business and has professionalized management, a necessary condition for stability and growth.
  • Vision: The leadership has a vision to become No. 3 player in each category in the next 3-4 years.
  • The VGI brand is strong, particularly in South/Kerala, and is now expanding all India. Fig 3.
  • VGI has expanded beyond the initial success of voltage stabilizers into related UPS, then house wiring cables, pumps and motors and household devices like fans, water heaters, etc. Fig 1 and 2.
Sales Distribution, JainMatrix Investments

Fig 3 – Sales Distribution

  • VGI owns two wind energy converters type E30 at Erode in Tamil Nadu with a capacity of 230 KW. Currently it produces 13 lakh units per annum, which is transferred to the state electricity grid.
  • Manufacturing: Considering the strong demand for wires, VGI has decided to double the capacity at the Kashipur plant in Uttarakhand from 3.3 million coils per annum to 6.6 million coils per annum in two phases. The investment for this was Rs 18 cr. VGI’s new plant for producing solar water heaters at Perundurai TN has gone on stream in 2013, with annual capacity of 90,000 solar water heaters.
  • It has an asset light model, and outsources more than 60% of its production.
  • Operational improvements in FY14 included reduction in its working capital cycle (by 8 days to 76), improvement in inventory days by 8 days and debtor days by 2 days, generating good cash flows.
  • R&D: VGI’s R&D Centre in Kochi was certified by the central govt’s Dept. of Scientific and Industrial Research (DSIR). Good R&D has reduced power consumption and improved products continuously.
  • VGI has recently won the ‘Innovative 100’ Awards 2013 hosted by Inc. India magazine, for the brand’s constant effort to bring in smart innovations in their product categories.
  • Advertising: VGI spent around 58 cr. (4.3% of revenues) on advertising in FY13, then increased it marginally in FY14 to 60 cr. (3.9%). Most of the expenditure in FY14 was targeted at the IPL.
  • Ad spends are to be maintained at 3.5-4% of revenues in FY15 as well.

Business Challenges:

  • Competition: In recent few years VGI has faced competition from Honeywell Automation, Genus Power Infra and Pearl Electronics. BEL is the largest player in electronics components in India. Havells is a large player in house wiring cables and fan segments in Non South regions.
  • Fans, heaters and kitchen appliances are established categories with organized and unorganized sector competition.
  • Many of the products have a negative correlation to overall development. The core voltage stabilizers product is threatened by improved power delivery by electricity utilities. It is also challenged by fridges and ACs bought pre-fitted with stabilizers.
  • Laptops and tablets too do not require UPS due to in-built chargeable batteries.
  • Seasonality affects demand – pumps, motors and stabilizers depend on rainfall and power supply.

Stock Evaluation, Performance and Returns

  • The price and dividend history (LINK) has shown a fine growth since it got listed in Mar’08.
  • The share is currently at its all-time high range. Dividend too has grown steadily in the last 7 years.
  • Revenues, EBITDA, Profits and Market Price grew at 33%, 27%, 11% and 49% CAGR over last 7 years.
  • Profit appears low only due to a high base effect in FY08. See Fig 4.
Quarterly Financials, JainMatrix Investments

Fig 4 – Quarterly Financials, by JainMatrix Investments

  • Revenues growth has been excellent, while the operational and profit margins are flat. The EPS has surged due to the volumes growth.
  • In addition, good operational decisions like more sourcing v/s in-house mfg have kept costs in check.
  • The Free Cash Flow has been positive in only 2 of the last 7 years. Fig 5. However the operational Cash Flow has been positive for 4/7 years. Investments have been made into capacity expansion and factories. The recent years show FCF is much higher. This is positive.
  • The historical average for PE of VGI is 20 times, and a range of 10-30 times over 7 years. See Fig 6.
  • The price chart shows an accelerating rise. The PE too is at 41.5 times, at all-time high levels. Thus it appears that VGI is overpriced at these levels.
  • The EPS for VGI peaked in Mar ’13 but has crossed these levels in the Q2FY15. See Fig 7.
Cash Flow and Dividend, JainMatrix Investments

Fig 5 – Cash Flow and Dividend, by JainMatrix Investments

Price, PE and EPS, JainMatrix Investments

Fig 7/8 – Price, PE and EPS, by JainMatrix Investments

  • ROCE and ROE are 26.1% and 24.2% respectively which is positive for the company.
  • The D/E of the firm has fallen to 0.47 (Q2FY15) from 0.6 (FY13), a good improvement.
  • Price to Book Value is at 10.3 (Q2FY15), which is high, but a sign of high insourcing of products.
  • PEG is 1.96 times, indicating high valuations.

Do you find this site useful?

  • Visit the Investment Service page to find how you can get more. Or Click LINK
  • Register Now to get our Free reports and much more, on the top right of this page, or by filling this Signup Form CLICK.

Benchmarking and Financial Estimates

We present a benchmarking exercise with listed peers in similar product categories.

VGuard Benchmarking, JainMatrix Investments

Fig 9 – Benchmarking, by JainMatrix Investments

  • VGI has excellent growth, returns and D/E characteristics.
  • Current Valuations are high, but overall VGI does fairly well in the comparison.

Financial Projections

We have carried out a financial projections exercise for VGI.

Fig 11 - VGuard Projections, JainMatrix Investments

Fig 11 – Financial Projections, JainMatrix Investments

Risks and Challenges

  • VGI has high brand recall in Kerala and Southern states. Future growth is dependent upon VGI being able to repeat and roll out its brand and distribution success nationally.
  • Dependency on the seasons like rains and summer. Here variations are getting worse every year.
  • Dependency on poor state electricity distribution for voltage fluctuations. This may improve slowly.
  • High competition in newer product categories like kitchen appliances, fans, geysers, etc. In particular VGI has to stay away from well-established global categories like computers, audio and audiovisual.
  • Volatility in raw material prices could impact margins in case cost escalations cannot be passed on to consumers.

Overall Opinion, Outlook and Recommendation

  • Strong brand that can be well leveraged for new products in South and all products in Non South.
  • Management that has grown businesses with good ambition, corporate governance and shareholder rewards.
  • Demand drivers for VGI include India’s rising population & affluence and the switching of consumers from unorganized sector to VGI products. These trends should drive demand for VGI products, even as competition in these categories intensifies.
  • The growing housing /real estate market can boost overall demand. Massive growth opportunities exist across household electrical and semi-electronic gadgets and equipment.
  • Robust distribution and dealer network setup in South that is being replicated across the country.
  • However at a PE of 41.5, PEG of 1.96 times and PB of 10.3 times, we feel valuations are stretched.
  • VGI is a Hold today due to excessive valuations.

JainMatrix Knowledge Base:

See other useful reports

Do you find this site useful?

  • Visit the Investment Service page to find how you can get more. Or Click LINK
  • Register Now to get our Free reports and much more, on the top right of this page, or by filling this Signup Form CLICK.

Disclosures and Disclaimer

  • This document has been prepared by JainMatrix Investments Bangalore (JM), and is meant for use by the recipient only as information and is not for circulation.
  • JM has been publishing equity research reports since Nov 2012.
  • Punit Jain has been a long term investor in VGI since Oct 2014. Other than this JM and its promoters/ employees have no financial interest in VGI and no known material conflict of interest as on date of publication of this report.
  • This document is not to be reported or copied or made available to others without prior permission of JM. It should not be considered or taken as an offer to sell or a solicitation to buy or sell any security.
  • The information contained in this report has been obtained from sources that are considered to be reliable. However, JM has not independently verified the accuracy or completeness of the same.
  • Neither JM nor any of its affiliates, its directors or its employees accepts any responsibility of whatsoever nature for the information, statements and opinion given, made available or expressed herein or for any omission therein.
  • Recipients of this report should be aware that past performance is not necessarily a guide to future performance and value of investments can go down as well. The suitability or otherwise of any investments will depend upon the recipient’s particular circumstances and, in case of doubt, advice should be sought from an independent expert/advisor.
  • Any questions should be directed to the director of JainMatrix Investments at jain@jainmatrix.com