——————————————————————————————————-
I read an article on another forum, An Ode to the Short-Term Trader (details in PS at the end). In essence it talks about how short term equity trading is a tough profession; technology advancements in the last decade have in fact loaded the dice further against these professionals.
I turned my thoughts to Technology in Long Term investing, and if long term investors are facing such challenges from technology, HFT, investing ideas distribution, etc….
Great Investors:
On one side, I don’t think the Warren Buffets of the world are at all worried by or about technology. I have heard that instead of maintaining cupboards of hardcopy annual reports, he now checks financial data online. But that’s about the only major technology oriented change he may have faced in 40+ years of investing……?
Individual Investors:
In fact, the investment transaction has become easier for individuals in India with de-materialization of shares and online trading websites that have reduced commissions, delays and errors. Investing is now as easy as operating a Bank Account.
On the other hand, the amount of information available to an investor has switched from too little, long back without internet, to too much right now. There is so much information at a company level, and so many options while looking for good companies to invest in. An individual investor has become like the modern supermarket buyer, overwhelmed by options. The challenge has now shifted to discerning the good advice, information and data, from the endless stream.
We at JainMatrix Investments hope to become an investment resource of choice for Indian Investors. :-)
The institutional investor versus Individual investor for Long Term investment was never a big issue. People like Peter Lynch have explained the advantages Individual investors have, especially with ‘invest in what you know’ and ‘the flexibility to look at any market capitalization, unlike Institutions’. So while the deep pockets from National and International Institutions will mostly look at Large Caps, the Individuals can invest more flexibly, and look for bigger gains in Mid & Small Caps (if they have the risk appetite).
High Frequency Trading:
My personal opinion is that HFT is no good, for trader or investor. It favors the institutions as only they can do it, it causes flash crashes and higher trading volatility (when unexplainably many supercomputers simultaneously do similar trades), and empowers individual firms while weakening the system. It’s sort of like giving an AK47 to everyone in the country to defend themselves. It’s bound to instead cause more shooting deaths.
Readers, any thoughts on this? You can respond in comments section below or by email to me.
A Recent Poll
On 26th Nov, I asked readers their opinion on a few subjects. I get this question a lot: What’s your outlook on the Indian markets? I thought I would try to gauge the mood of readers themselves. See LINK. Here are the results:
Outlook for Indian equity markets
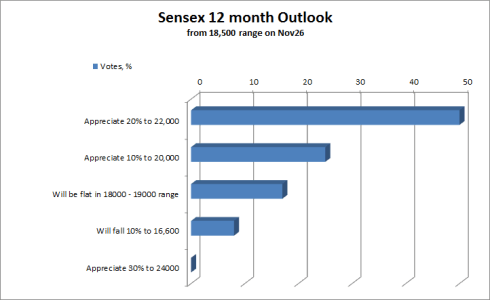
Fig 1 – Sensex 12 month Outlook, JainMatrix Investments
- It’s wonderful to see the optimism from readers.
- Also we are not yet in an exuberant mood with 30% getting zero votes.
- Note that we are already up 4.8% today from Nov 26 levels.
Equity Research Report size
On a different note, we at JainMatrix Investments are keen to respond to subscriber requests and tweak the services as required.
We Polled subscribers on the size and format of the equity research reports we create. Should they be shorter and very pointed, or should we retain the current 7 page exhaustive information and template. Here are the results:

Fig 2 – Equity Research Report Size, JainMatrix Investments
- The maximum people are of the opinion that we retain the current 7 page size
- I will modify the report so that busy readers need to read only the first page which is an executive summary.
Thanks to readers who took the trouble to answer these Polls.
PS – The link to the article “AN ODE TO THE SHORT-TERM TRADER” is available at: http://www.zenpenny.com/an-ode-to-the-short-term-trader/
SUBSCRIBE
JainMatrix Knowledge Base
See other useful reports
- An upcoming IPO – Bharti Infratel IPO: Aggressive Passive offering
- Consumer Sector – Who leads the FMCG Pack?
- Bata India has Happy Feet
- Hanung Toys & Textiles – Look for the Rebound
- Tribhovandas Bhimji Zaveri – A Glittering IPO
Disclaimer
These reports and documents are prepared by JainMatrix Investments Ltd. They are not to be copied, reused or made available to others without prior permission of JainMatrix Investments. Any questions should be directed to the director of JainMatrix Investments at punit.jain@jainmatrix.com


