_________________________________________________________________
- 03-Feb-2014
- CMP: Rs 880
- Mid Cap – Mkt Cap 10,500 crores
JainMatrix Investments has published a report on Britannia Industries for its Subscribers. A partial report is available below. Edited from it are Product Overview, Risk factors, Bench-marking, Financial Projections and 2 year target prices for BIL stock. The JainMatrix Investment service is available for a subscription fee.
Here is a note on Britannia Industries (BIL).
Britannia Industries is a leading Indian food processing firm, making biscuits, dairy products and bakery items like cakes, rusks and breads. This firm has seen a turnaround since 2010, with fair revenue growth, but excellent margin improvements. The ongoing initiatives in manufacturing capacity addition, sales team synergies and ‘nutrition’ oriented product launches should see BIL emerge as a premium food giant. Buy.
Business Profile
- Britannia Industries (BIL) is a Bangalore based firm selling bakery and dairy products. Started in 1892, it is one of the largest food processing firms in India.
-
Sales turnover in FY13 was Rs 5,615 crores and PAT is 233.9 cr. Sales have grown 7.5% (CAGR) over the last 5 years. Market Cap is 10,500 cr., ranked 3rd in India in the food processing industry.
- BIL has 30-33% biscuit market share in India, and a reach of 36 lakh retail outlets across the country. It has about 2190 employees.
- The shareholding pattern is: Promoters-50.8%, FII’s-19.1%, Individuals/HNI-17.2%, FIs/Insurance-5.6%, MFs-4% and Bodies Corporate 3.3%.
- Key executives are: Chairman Nusli Wadia, MD Vinita Bali, and COO Varun Berry.

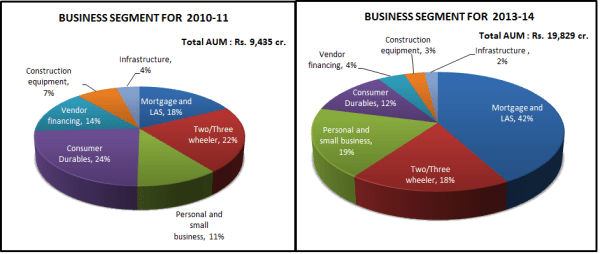
Fig 1 – Business Segments, JainMatrix Investments
Click on any graphic in report to see in full size.

Fig 2 – Key Brands, JainMatrix Investments
- BIL’s products are high volume food products. It has a large distribution network reaching ~36 lakh outlets, with more than 40% of the consumption in rural India.
- Economic Times Brand Equity placed BIL among the top 10 trusted brands of India.
Recent Events and Strategies
- BIL is adding production capacities, and also reducing the dependence on contract manufacturing. To manufacture its own products, BIL has spent nearly Rs 300 cr to add capacities, much of which was earlier outsourced. Three new plants have come up in Bihar, Odisha and Gujarat. These plus one in TN will take the total plants owned by BIL to 12. These will take care of 50% of the company’s manufacturing needs, with the rest coming from contract manufacturers.
- BIL is planning to set up another wholly owned subsidiary for baked goods in Tamil Nadu, to serve South Indian markets, at an estimated cost of Rs 100 crores in early 2015.
- BIL is also driving innovation across the existing categories and has strengthened its R&D for this.
- Synergies were created through integration of the bakery and dairy sales and distribution system.
- Increased distribution of more high-priced products in urban areas, at the same time concentrating on rural areas is going to be the company’s primary objective for the FY14, according to company’s COO Varun Barry, which should help BIL grow sales by 15% in FY14.
- MD Vinita Bali is set to exit the company in March’14 and will be succeeded by COO Mr. Varun Barry. The latter is already head of the India operations. He is also undertaking a management restructuring, to make the top team smaller and more focused.
Stock Evaluation, Performance and Returns
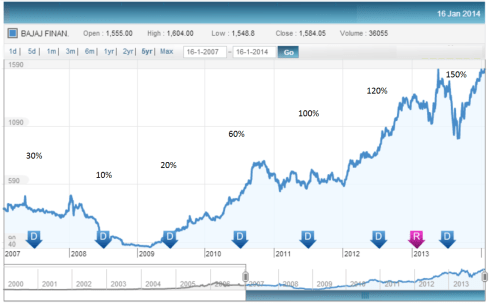
- The price and dividend history is detailed in Fig 3. There was a split in Face Value (10 to 2) in 2010.
- Post 2010 BIL has started a sharp uptrend. Investors in BIL over the last 5 years have seen a return on 25% CAGR on the share price. In the past 1 year itself, the share has appreciated over 60%.
- Revenues have grown at 15.7% of CAGR in the past 4 years. The EBITDA and PAT have grown at 7.9% and 6.7% respectively in this period.
- The all-time high of 972 was hit in Oct 2013. It is at 9.5% below these levels.

Fig 3 – Price History, JainMatrix Investments

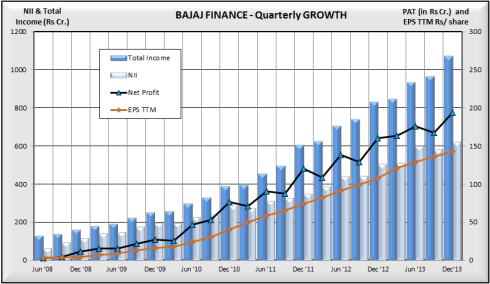
Fig 4 – Quarterly Financials, JainMatrix Investments
- The EPS has increased by 6.7% CAGR over the last 5 years – Fig 4. However post the losses of Mar’10, the recovery has been rapid. Dividend too has followed a similar pattern. The reasons for this are a combination of volumes growth and better margins.
- Standalone Free Cash Flow has been positive for the last 5 years (Fig 5), this is positive. It allows the firm to reinvest in the business or reward shareholders. Dividend too has increased. Yield is 1%.

Fig 5 – Cash Flow, Dividend, JainMatrix Investments

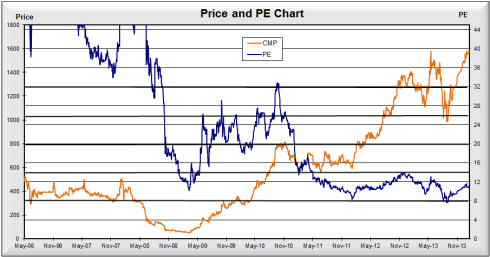
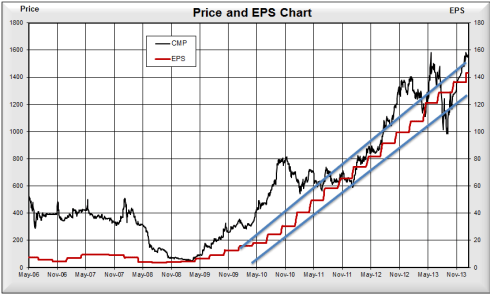
Fig 6 – Price PE Chart, JainMatrix Investments
- The P/E after FY11 has been in the 26-40 range, Fig 6. At 31 times today it’s in the low-end of this.
- We can see the recent surge in EPS – Fig 7. The Price of BIL has been tracking EPS growth. The EPS now is in the channel indicated in the Chart.

Fig 7 – Price EPS Chart, JainMatrix Investments
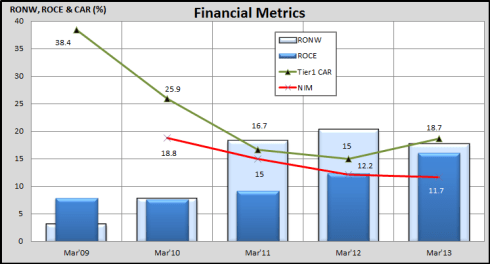
- Other relevant consolidated financial parameters –
- ROCE and RONW are 44.5% and 46.7%, both excellent numbers
- BIL has just 24 cr. of equity capital; there is a good chance of bonus, split, dividend increase or other shareholder reward if performance continues to excel.
- Debt equity fell from 0.61 (FY13) to 0.3 (Q1FY14), indicating a fast improving Balance Sheet.
- PEG at 0.4 indicates undervalued status.
Opinion, Outlook and Recommendation
- Buy
JainMatrix Investments has published a report on Britannia Industries for its Subscribers. A partial report is available below. Edited from it are Product Details, Risk factors, Bench-marking, Financial Projections and 2 year target prices for BIL stock. The JainMatrix Investment Service is available for a subscription fee.
JainMatrix Knowledge Base:
See other useful reports
- Bajaj Finance
- Are we in a new Bull Run
- Repco Home Finance
- Power Grid FPO 2013 – Apply
- Just Dial Ltd – An Equity Research Report
- Future Gazing – Business and the Internet of Things
- Balkrishna Industries – The Tyres Roll Faster
- BHEL – a Power Value Play
- Cairn India – A Formula for Success
- Mindtree Ltd. – A Possible Star
Disclosure: It is safe to assume that if the JainMatrix website recommends a stock, the researcher has already invested in it.
Do you find this site useful?
- Visit the SUBSCRIBE page to find how you can get more. Click LINK
- Register Now to get our Free reports and much more, on the top right of this page, or by filling this Signup Form CLICK.
Disclaimer:
These reports and documents have been prepared by JainMatrix Investments Ltd. They are not to be copied, reused or made available to others without prior permission of JainMatrix Investments. Any questions should be directed to the director of JainMatrix Investments at punit.jain@jainmatrix.com