Yes Bank – A Rediscovery

  • 02 Apr 2014
  • CMP: Rs 415
  • Large Cap – Mkt Cap 14,900 crores.
  • Advice:  Buy

JainMatrix Investments has published a report on Yes Bank for its Subscribers. A partial report is available below. Edited from it are Financial metrics, Risk factors, Bench-marking, Financial Projections and 2 year target prices for YB stock. The JainMatrix Investment service is available for a subscription fee.

SUBSCRIBE NOW. Click on See Offering

Key Reasons to Invest:

  • The 24% fall since May ’13 is temporary in nature and gives an opportunity to invest at lower levels
  • Aggressive growth will continue in 20-35% range, with stable NIMs and profitability
  • Investments in Retail and SME will provide next phase of expansion
  • Resurgent share price indicates a recovery has started

Description and Profile

  • Yes Bank (YB) started in 2003, received the only greenfield bank license by RBI in last 15 years.
  • Based in Mumbai, Yes Bank’s FY13 revenue was Rs 9551 crore and net profit of 1300 cr.
  • Its market cap is 14,929 cr and it is among the top 6 private banks in India.
  • The leaders are Rana Kapoor (Founder, MD, CEO), Alok Gupta, Aditya Sanghi and Ajay Desai.
  • Share pattern %: Promoter 25.6, FIIs 39.6, MFs/DII 19.3, Retail/HNI 11.9, Corporate 2.5& Others 1.1.
  • YB has employee strength of over 9000, the bank branches are 550 and about 1,150 ATMs in India.
  • YB is focused on its Retail and MSME Loan portfolio, which has grown sharply, see Fig 1.
Business Segments, JainMatrix Investments

Fig 1 – Business Segments, JainMatrix Investments, click image to enlarge

Recent News and Updates

  • The recent Q3FY14 results were good. Net profit at 415.6 cr grew 21.4% YoY. NIM at 665 cr grew 13.9% YoY. NIM is at 2.9%. However results were not as good as Q2FY14.
  • RBI has permitted YB along with 5 other banks and 3 financial institutions to import gold under the 80:20 scheme. This is expected to lower gold cost and help the country’s external balances.
  • YB has raised USD 500 m in foreign currency loans and deposits in FY14 after regulatory relaxations introduced in the fiscal. RBI relaxed regulations by raising the borrowings limit from 50% to 100% of Tier I capital and concessional FCNR (B) deposit swap window. The loan facilities will be used to scale up general corporate lending and small and medium enterprise loan portfolios.
  • Ongoing Promoter legal tussle: Madhu Kapur, widow of Yes Bank co-founder Ashok Kapur, opposed in court the nomination of three directors to the lender’s board, an initiative led by her brother-in-law Rana Kapur. And, the Bombay HC admitted the plea.
  • Revised monetary policies favor YB. The RBI’s move to boost liquidity has brought down the Marginal Standing Facility rate from 10.25% (in July’13) to 9.0% (in Jan’14). This is positive for YB due to significant wholesale funding.
  • Savings rates deregulation in Oct’11 has aided retail customer acquisition, as YB aggressively hiked savings interest rates and shifted focus to growing the retail business.

Unique Strengths and Superior Strategies

  • YB has a vision to become “A global bank” and “India’s #4 private sector bank by 2015”. They have invested 60-75 cr. to expand branch network, and plan to open 100 new branches.
  • Their Vision-2015 was to create human capital of 12,750 employees, have 900 branch strength and a balance sheet of 150,000 cr. The bank is stretching to meet these objectives.
  • YB is focused on research and knowledge lead banking services. It pioneers lending to new sectors that have high potential growth prospects.
  • YB has a diversified and De-risked Credit Book.
Diversified Credit Book, JainMatrix Investments

Fig 2 – Diversified Credit Book, JainMatrix Investments

  • YB practices a strong employee value proposition of “Creating and Sharing value” with a vision to build their organization driven by professional entrepreneurship.
  • YB is focusing on the SME sector with access to finance and to help them excel in future.
  • YB has aggressively grown the CASA deposits to 20.9% from 18.3% last year. YB offers the savings bank interest rate of 7%, which is highest in the industry.
  • In an economy that used to be denied good banking, Yes Bank is building its brand around positivity, good services and fast approvals.

Stock Evaluation, Performance and Returns

  • YB had its IPO in July’05 priced at Rs 45. It was 31 times oversubscribed. At CMP of Rs 414 today, the stock has given a 28% CAGR return since IPO.
  • The share has risen well, but is volatile. After IPO, price rose to 277 in early 2008, fell to 41 in Mar ’09 and peaked at 547 in May ’13. Today, it is 24% below this peak price.
  • The Price fall around July-Aug’13 was much sharper for YB (56%) than the CNX Bank (33%).
  • This fall is linked to the events of 1) Taper of the monetary easing by Fed Bank in USA 2) A sharp fall in INR/USD value. 3) A case against YB by Promoter/owner Madhu Kapur.
  • Also YB which was an investment & trading favorite and had touched its all-time high of 547 in May’13, may have fallen more sharply due to exits by the trading community.
  • Total Income, NII & Other income and Profits have grown at 38%, 36% and 41% CAGR over 6 years.
Yes Bank Financials, JainMatrix Investments

Fig 3 – Yes Bank Financials, JainMatrix Investments

  • While total income has grown rapidly, margins have fallen a little in the last 3 years. This is natural as Yes Bank is growing into a Large Cap from a Mid Cap size. See Fig 3.
Yes Bank, Book Value, dividends, JainMatrix Investments

Fig 4 – Yes Bank, Book Value, dividends, JainMatrix Investments

  • The first dividend of Rs 1.5 was paid in ‘10, and since dividend has shown a steady increase, Fig 4.
  • The P/B ratio has fallen over 6 years, in spite of price rise, due to rapid growth in Book Value.
  • While NIM% has been flat for 5 years, other financial metrics like RoNW, RoE, CAR and CASA are showing YoY improvements. NIM has been between 2.7-3.2% over the past 5 years. This is low by industry standards as CASA is low. Capital Adequacy is at 18.3%, which is good. The ranges of ROE (20-25%) and RONW (15-23%) for last 5 years are high and growing.
  • The PE chart 5 shows that average PE over the last 6 years has been 15, with a range 5-25.
Yes Bank PE and EPS charts, JainMatrix Investments

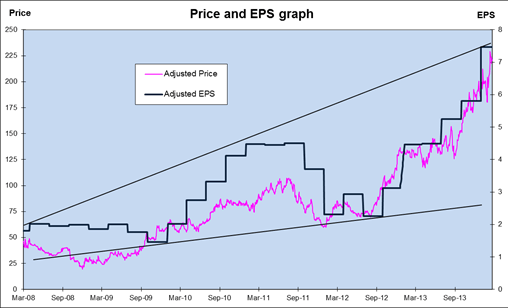
Fig 5-6 – Yes Bank PE and EPS charts, JainMatrix Investments

  • PE has fallen today to 9.55 and is in the lowest quartile. This fall was in spite of EPS growth, Fig 6.
  • Price and EPS quarterly graph, shows that EPS has been rising very steadily. The Share Price has been roughly following EPS, except for the last one year.
  •  We expect the EPS of YB to stay within the channel in Fig 6.
  • It appears from Fig 6 that the price fall is not based on financials/ EPS but due to other reasons.
  • Gross & Net NPA rose by Q3FY14 to 0.39% & 0.08%, but are still at lowlevels for the industry.
  • Beta of the stock is 1.98 (Reuters) indicating high volatility.
  • Dividend yield is 1.46%, which is good for the banking sector.
  • PEG is at 0.36 – indicates safety and an undervalued stock.

Opinion, Outlook and Recommendation

  • India is under-banked. There is potential for Banks to invest in new sectors and stimulate growth.
  • The banking industry is a proxy to the overall economy, and should grow at 12-17% p.a.
  • YB as a new private bank is well placed to exploit the trend of Private sector growing faster than PSBs, will continue to be in the 20-35% range for the next 3 years.
  • The recent price fall of 24% since the peak in May ’13 provides an opportunity to invest in YB.
  • In Mar’14 YB crossed its 200DMA and has stayed above it for 2 weeks already. It is a bullish sign and may signal a long positive period for the stock.
  • YB will continue on the path of solid stock performance and dividends over the next decade. Invest now and systematically to gain for the long-term.
  • Our Call is a BUY.

JainMatrix Knowledge Base:

See other useful reports

Do you find this site useful?

  • Visit the SUBSCRIBE page to find how you can get more. Click LINK
  • Register Now to get our Free reports and much more, on the top right of this page, or by filling this Signup Form CLICK.

Disclaimer:

This document has been prepared by JainMatrix Investments Bangalore (JM), and is meant for use by the recipient only as information and is not for circulation. This document is not to be reported or copied or made available to others without prior permission of JM. It should not be considered or taken as an offer to sell or a solicitation to buy or sell any security. The information contained in this report has been obtained from sources that are considered to be reliable. However, JM has not independently verified the accuracy or completeness of the same. Neither JM nor any of its affiliates, its directors or its employees accepts any responsibility of whatsoever nature for the information, statements and opinion given, made available or expressed herein or for any omission therein. Recipients of this report should be aware that past performance is not necessarily a guide to future performance and value of investments can go down as well. The suitability or otherwise of any investments will depend upon the recipient’s particular circumstances and, in case of doubt, advice should be sought from an independent expert/advisor. Either JM or its affiliates or its directors or its employees or its representatives or its clients or their relatives may have position(s), make market, act as principal or engage in transactions of securities of companies referred to in this report and they may have used the research material prior to publication. Any questions should be directed to the director of JainMatrix Investments at punit.jain@jainmatrix.com

JainMatrix Investments Mid-Cap Portfolio Investment Note

Date: 20th Mar 2014

JainMatrix Investments launched its Mid Cap portfolio in Feb 2013. This is the March 2014 update of this Model portfolio along with a review of the performance and a recap of the individual stocks.

Here’s the brief investment note:

  • The year 2014 opened on a positive note. The major Indices are at all-time highs, and we are seeing heavy investments by FIIs and a pre-election rally, since the election schedule was announced on 5th March.
  • The election results are unpredictable, and more so the effect of these on the economy. But our feel is that the economy is past its worst, and is on a recovery path.
  • The INR/USD appears to be gaining strength, another sign of improvement. Inflation appears to be down, perhaps from improving supply rather than falling demand. With good rainfall this year, we are seeing better agricultural production. The beaten down sectors such as capital goods, infrastructure, oil & gas and mid-caps, are seeing a revival.
  • The uncertainties on the horizon include an inconclusive election result, USA monetary tightening and the Ukraine – Russia tensions.
Embed from Getty Images
  • Theme: The investment theme for now is – exports, private sector banks, NBFCs and selective infrastructure. The investor should continue his wealth building process with Mid-Caps.
  • Performance: In a volatile environment, the portfolio performed very well. On average the 6 Buy recommendation shares were up by 40.8%. But including the one Hold and one Sell (recommendations in Dec 2013) the portfolio gained by an absolute 16.5%.
  • This compares well with the Benchmark Indices CNX Midcap (-6.5%) and BSE Midcap (-7.4%) which fell in this period.
  • There is one addition to this portfolio, in this report, so now there are 7 shares in this portfolio that are BUY recommendations and one Hold.
  • Investors need to continue to invest in these shares in a SIP mode.

The rest of this report is shared with only current subscribers. 

Some previous Updates for this Portfolio

Not a subscriber? Sign up for a JainMatrix Investments subscription to help navigate your investment journey. Visit  Subscribe

Do you find this site useful?

  • Visit the SUBSCRIBE page to find how you can get more. Click LINK
  • Register Now to get our Free reports and much more, on the top right of this page, or by filling this Signup Form CLICK.

Disclaimer

This document has been prepared by JainMatrix Investments Bangalore (JM), and is meant for use by the recipient only as information and is not for circulation. This document is not to be reported or copied or made available to others without prior permission of JM. It should not be considered or taken as an offer to sell or a solicitation to buy or sell any security. The information contained in this report has been obtained from sources that are considered to be reliable. However, JM has not independently verified the accuracy or completeness of the same. Neither JM nor any of its affiliates, its directors or its employees accepts any responsibility of whatsoever nature for the information, statements and opinion given, made available or expressed herein or for any omission therein. Recipients of this report should be aware that past performance is not necessarily a guide to future performance and value of investments can go down as well. The suitability or otherwise of any investments will depend upon the recipient’s particular circumstances and, in case of doubt, advice should be sought from an independent expert/advisor. Either JM or its affiliates or its directors or its employees or its representatives or its clients or their relatives may have position(s), make market, act as principal or engage in transactions of securities of companies referred to in this report and they may have used the research material prior to publication. Any questions should be directed to the director of JainMatrix Investments at punit.jain@jainmatrix.com

Central Public Sector Enterprises ETF – Invest

_____________________________________________________________________________

  • Report Date 21-Mar-2014
  • NFO Offer Period – 19-21st March 2014
  • Mutual Fund Nature – Large Cap PSUs ETF
  • Will launch at Rs 10 NAV
  • Advice: Buy

Here is a note on the Central Public Sector Enterprises – Exchange Traded Scheme – NFO.

Offer Description

  • Goldman Sachs is launching the CPSE ETF through a New Fund Offer (NFO)
  • CPSE Index will facilitate GoI’s (Govt of India) initiative to dis-invest some of its stake in CPSEs through the ETF route.
  • Ten leading PSUs’ will be included in this ETF at offer stage
  • Typically these are fairly well known high dividend, low capital gains but asset rich companies
  • Already in the first 3 days of Offer, the fund has collected Rs 2400 crore of the Rs 3000 cr targets.
  • Analysis of these ten PSUs as part of this ETF
CPSE analysis, JainMatrix Investments

CPSE analysis, JainMatrix Investments

Note here: 1) Coal India price is taken from the IPO price to today 2) EIL FPO report by JainMatrix Investments is available at LINK

Pros

  • The ETFs have a lower management charge as stock selection and portfolio changes are automatic. The expense ratio is 0.49% annualized
  • Retail investor ie. who invest upto Rs 2 lakh get special Loyalty Units of 6.67% for holding this ETF for 1 year
  • The fund will offer 5% discount to the NFO subscribers
  • Average dividend yield for these stocks is 3.57% calculated as of today.
  • See figure above, the average share price appreciation over last 5 years is 9.4% for the entire basket. This of course can vary widely from year to year.
  • These together appear to offer the Retail investor about 24% returns in the first year assuming average appreciation of the share prices.
  • Many of these firms own wonderful assets, the family silver of the GoI. These firms also enjoy monopoly status in their sectors. 

Cons

  • However it is sad to see how this family silver has been eroding in value over the years.
  • The constraints within which these PSUs work makes it difficult to grow enterprise value and profits.
  • In Oil and Gas sector, the largest risk to corporate performance is ad hoc Subsidy systems and highly taxed products.
  • The Dividend yield in above table is for the recent year. This may look better than previous years due to the GoI demands for dividends to meet budgeted finance targets.
  • Most of these stocks are asset heavy and resource rich firms. Their performance depends upon revenue growth, which has not been high and varied widely in recent years.
  • Many of these firms depend on govt policies and monopoly situations to grow.
  • This fund is Oil and Gas heavy with 59-60% weightage. If one extends the description to Energy/Coal/ Power/ Oil and Gas and related financing, it increases to 92%. These sectors are essential to the economy, but are typically constrained and not shareholder friendly sectors.
  • The general elections of 2014 may have a big bearing on the share prices of these firms. Typical market risks apply to such investments.
  • The government as an owner/promoter in modern times may be driven by political and financial constraints rather than the original ‘Nation building’ objectives.
  • If GoI proceeds on dismantling the Administered Price Mechanism in Oil & Gas, and allows Coal India, ONGC, etc to truly work freely without govt constraints and subsidy systems, they are incredibly valuable firms and this fund can skyrocket. However this has not happened in the last 10 years.

Overall Opinion

  • This is a low risk, high dividend value oriented ETF offering.
  • There is a fair commitment for Retail gains, pegged by JainMatrix Investments at 24% above for the first year. Market performance can affect this number in either direction.
  • After 1 year investor will need to review the performance of the fund for continued ownership and their delivery against objectives.
  • The low risk Retail investor may invest in this Fund for the first year.

Do you find this site useful?

  • Visit the SUBSCRIBE page to find how you can get more. Click LINK
  • Register Now to get our Free reports and much more, on the top right of this page, or by filling this Signup Form CLICK.

Disclaimer

This document has been prepared by JainMatrix Investments Bangalore (JM), and is meant for use by the recipient only as information and is not for circulation. This document is not to be reported or copied or made available to others without prior permission of JM. It should not be considered or taken as an offer to sell or a solicitation to buy or sell any security. The information contained in this report has been obtained from sources that are considered to be reliable. However, JM has not independently verified the accuracy or completeness of the same. Neither JM nor any of its affiliates, its directors or its employees accepts any responsibility of whatsoever nature for the information, statements and opinion given, made available or expressed herein or for any omission therein. Recipients of this report should be aware that past performance is not necessarily a guide to future performance and value of investments can go down as well. The suitability or otherwise of any investments will depend upon the recipient’s particular circumstances and, in case of doubt, advice should be sought from an independent expert/advisor. Either JM or its affiliates or its directors or its employees or its representatives or its clients or their relatives may have position(s), make market, act as principal or engage in transactions of securities of companies referred to in this report and they may have used the research material prior to publication. Any questions should be directed to the director of JainMatrix Investments at punit.jain@jainmatrix.com

VST Tillers Tractors – Agro Growth

________________________________________________________________________

  • Date 4th Mar 2014,
  • CMP: Rs 825
  • Small Cap – Mkt Cap 716 crores
  • Advice: Buy

Here is a note on VSTT (VST Tillers and Tractors Ltd).

Business Overview

  • VSTT is an agriculture equipment manufacturing firm with products like tractors, power tillers and rice planters.
  • Its turnover in FY2013 was 482 crores, with profits at 49 cr. Market Cap. today is 716 cr, at CMP 825.
  • The mfg plant is at Whitefield, Bangalore for all 3 products with capacities of tractors (5k), tillers (25k) and engines (32k). It has commissioned a new tractor plant in Hosur, TN with capacity of 36k tractors. (k=1000)
  • VSTT has tie ups with several companies of Mitsubishi of Japan for tractors, tillers and diesel engines.
  • The Sales numbers in FY13 were tractors (6,233), power tillers (21,231) and rice planters (404).
  • Products are also exported – Forex revenues in FY13 were 16 cr., while imports were 21 cr., a net importer.
  • VSTT has a strong brand and good reputation in the farm sector in India.
  • Domestic sales are through a nation-wide network of Dealers. See segments Fig 1.
Business Segments, JainMatrix Investments

Fig 1 – Business Segments, JainMatrix Investments

  • Shareholding pattern is Promoters – Indian 51%, Foreign 3%, MF/FII/Institutions 7.8%, Individuals 30.2%, Bodies Corporate 6.4% and Others 1.6%. It appears to be widely distributed in Retail.

Capacity Expansion

  • The Hosur plant was set up with 70 cr investment and was funded through internal accruals.
  • It will have a 36k tractor capacity. At full capacity it will generate revenue of 890 crores. Thus in a 2 year period the current revenues can triple. (JainMatrix estimates – based on FY13 tractor average revenue of 2.47 lakh/unit)
  • Tractor is a fast growing segment, and the projected sales volume will be 7.1% market share (of FY13 market).
  • To expand exports, VSTT has successfully homologated and obtained export certification to expand its global footprint for tractors, for the current markets of Africa, Middle East, Russia and Turkey, and beyond.
  • This aggressive growth plan looks possible.

Agriculture Sector

  • In India, agriculture is a steady industry with a growth rate of 3.3 % (CAGR) over last 7-8 years. The projection for FY14 is 4.8% growth, compared to FY13 with just 1.9% growth. (per PM’s Economic Advisory Council).
  • VSTT represents the mechanisation and automation requirements of farming. This trend is visible with the rising cost of rural labour and productivity pressures.
  • Food demand in India is inevitably surging as 1) the population grows 2) improving affluence of population, all results in 3) better diet and nutrition levels.
  • The govt. has boosted agriculture with tax concessions for farmers and funding schemes for their investments. It has also raised Minimum Support Price (MSP) for produce and they buy from farmers at these higher rates.
  • The Power Tiller industry relies heavily on Government subsidies and schemes for funding purchases.
  • The Indian tractor market is the largest in the world. Tractor sales in FY13 were 5,90,672 units.
  • Thus VSTT at 6,233 had just 1% of the Indian tractor production in FY13.

Share Overview, Financials and Valuations

  • The Share of VSTT with FV=10 has risen sharply by 151% in last 1 year. See Fig 2.
  • It’s a regular dividend stock, and the 90% declared has a dividend yield of 1%.
  • There was a share bonus in 2010 with ratio 1:2.
Share Price, JainMatrix Investments

Fig 2 – Share Price, JainMatrix Investments

  • Revenues, EBITDA and PAT have grown at 18%, 21% and 22% CAGR over a 5 year period. See Fig 3.
  • Margins are showing an improving trend over the last 3 years.
  • Current P/E is 9.8 times (TTM). Price/ Book is 2.9 times.
  • The FY14 estimate shows a good upside on EPS. The projected P/E based on this will be 9.2 times.
 VSTT Financials, JainMatrix Investments

Fig 3 – VSTT Financials, JainMatrix Investments

  • Cash flow has been mostly positive or a small negative, see Fig 4.
Cash Flow, JainMatrix Investments

Fig 4 – Cash Flow, JainMatrix Investments

  • Debt is zero, and cash on hand is 32.9 cr, about Rs 38/share.
  • ROCE is 29% and RONW is 18%. These are very high, and also may rise in 1-2 years with the utilization of the new capacities.
  • PEG at 0.38 indicates undervalued status.

Overall Opinion

  • VSTT is a firm riding on three clear trends:
    • Automation in Indian farming is up as farming incomes rise even as rural wage costs inflate. 
    • Massive expansion of VSTT tractor manufacturing capacity which can triple revenues in 2 years. 
    • FY14 will be a very good year for Indian agriculture, providing incomes needed to invest in automation.
  • Based on all this, VSTT is an aggressive agricultural growth stock.
  • Buy with a 2-3 year perspective.

JainMatrix Knowledge Base:

See other useful reports

Do you find this site useful?

  • Visit the SUBSCRIBE page to find how you can get more. Click LINK
  • Register right now to get our Free reports and much more, on the top right of this page, or by filling this Signup Form CLICK.

Disclaimer

This document has been prepared by JainMatrix Investments Bangalore (JM), and is meant for use by the recipient only as information and is not for circulation. This document is not to be reported or copied or made available to others without prior permission of JM. It should not be considered or taken as an offer to sell or a solicitation to buy or sell any security. The information contained in this report has been obtained from sources that are considered to be reliable. However, JM has not independently verified the accuracy or completeness of the same. Neither JM nor any of its affiliates, its directors or its employees accepts any responsibility of whatsoever nature for the information, statements and opinion given, made available or expressed herein or for any omission therein. Recipients of this report should be aware that past performance is not necessarily a guide to future performance and value of investments can go down as well. The suitability or otherwise of any investments will depend upon the recipient’s particular circumstances and, in case of doubt, advice should be sought from an independent expert/advisor. Either JM or its affiliates or its directors or its employees or its representatives or its clients or their relatives may have position(s), make market, act as principal or engage in transactions of securities of companies referred to in this report and they may have used the research material prior to publication. Any questions should be directed to the director of JainMatrix Investments at punit.jain@jainmatrix.com

_________________________________________________________________________

Motherson Sumi Systems – Global Auto Ancillary Growth

________________________________________________________________________

  • Report Date: 25 Feb’14
  • Market Price: 220
  • Large Cap – Mkt Cap 19,460 crores
  • Advice: Buy with a Mar’16 target of 451, a 104% appreciation

Motherson Sumi Systems is an Indian auto ancillary firm that is growing rapidly through global acquisitions. It cut its teeth as a Maruti Suzuki vendor, then expanded capabilities, product lines and customer base. In recent years it bought undervalued global plants and rapidly turned them around, and now has operations in 25 countries, supplying to all major auto firms. Revenues, EBITDA and Net profits have grown at 77%, 57% and 20% CAGR over the last 5 years. The current high debt should be reduced soon to comfortable levels. MSS is a BUY at current levels.

Description and Profile

  • Motherson Sumi Systems (MSS) is a Noida UP based Auto Ancillary firm operating in 25 countries.
  • FY13 consolidated Revenues were Rs 25,200 cr, EBITDA 1,798 cr and Net Profit 451 cr.
  • The flagship of the Samvardhana Motherson group, MSS consolidates business with Samvardhana Motherson Peguform (SMP) and Samvardhana Motherson Reflectec (SMR), owns 51% of both. MSS is a JV with Sumitomo Wiring Systems (Japan), and has JVs with Japanese, German and U.K. firms.
  • Vivek Chand Sehgal is the Vice Chairman of MSS. The shareholding pattern in % is: Promoters is 65.6% (Indian 40 & Foreign 25.6) FIIs 17.2, DIIs 7.8, Individuals (Retail/HNI) 5.8, and Others 3.6%.

Business Notes

Business Segments

Fig 1 – Business Segments

  • MSS is a major supplier of components, modules and systems to the auto industry globally. These include Polymer Components, Mirrors, Wiring Harness and Rubber & Metal products. Fig 1.
  • The diversified customer base includes most dominant Auto firms. Fig 2.

Customers

Fig 2 – Excellent Customer Base

  • The company offers products in both automotive and non-automotive segments. However non-automotive is very small at about 2%.
  • In non-automotive segment, the company is the largest supplier to industrial forklifts and material handling manufacturers. It also manufactures and assembles water purifier for HUL in India.

Strategies and Events

  • MSS has strong customer relationships and is focused on increasing its Content Per Car. It is mostly the OEM supplier, and this simplifies the Auto company’s vendor management process.
  • Revenues from overseas operations in MSS consolidated grew to 83% (FY13) from 66% (FY11). MSS expanded its global operations and acquired undervalued assets, with 9 acquisitions in 10 years.
  • Post-acquisition of loss making auto ancilliary assets, the MSS management was extremely focused on a plant by plant turnaround, which has been the main reason for MSS success.
  • But the international focus hasn’t hurt the company’s local operations, which are growing fast and setting up new plants. MSS is a key supplier to Hyundai, Maruti Suzuki, M&M and Tata Motors. The domestic auto sector slump did not affect it as exports posted a 25% growth.
  • MSS has an excellent de-risking strategy – the growth should happen such that no Single Customer, Single Country or Single Commodity should constitute more than 15% of the turnover.
  • According to the plan of MSS, by 2015 the company will become a $5b company, increase the global presence to 27 countries, and achieve a ROCE of 40%. It is already close to achieving many of these targets.
  • In May’12, an IPO of Samvardhana Motherson Finance, a group firm, was withdrawn due to poor investor response. MSS is the only India listed firm from this group.

Stock Evaluation, Performance and Returns

The price history of MSS is mapped here.

  • After the 2008 economic slowdown MSS share price fell to a low of 25. It has been on a steady recovery path to a recent Feb 2014 price of 231.
  • In 5 years, the share price has appreciated at 50% CAGR, providing excellent returns to investors.
  • Three bonus issues in the last 7 years (and 4 in last 10) have also accelerated the returns.

Financials

Fig 3 – Quarterly Sales, Margins and EPS

  • Revenues, EBITDA and Net profits have grown at 77%, 57% and 20% CAGR over the last 5 years.
  • The quarterly financials of MSS Fig 3, reveal periodic surges in revenues, due to new acquisitions. In 2009, Visiocorp became a part of MSS (renamed SMR). In 2011, Peguform was acquired (SMP).
  • Margins are on recovery path, along with a massive growth in volumes, reflecting in the adjusted EPS.
  • MSS has been investing heavily in its operations, Fig 4, even so it is enjoying good Cash flow from Operation, and a positive Free Cash Flow.
  • Dividends have steadily increased over the last 6 years. Including bonuses, it is up almost 3.5 times.

Cash Flow

Fig 4 – Cash Flow & Dividend – Standalone

Price and PE_1

 Fig 5 – Price and PE movements

  • The Price and PE chart, Fig 5, reveals the variations in PE values along with the steady share price appreciation. In the last 5 years, the PE ratio has been in a range of 15-35 times, while this historical average is 25 times.
  • Today it is at 29 times, on the upper half of this range.
  • In the Price and EPS chart, Fig 6, we can see a sharp surge in EPS over the last 2 years. The share price has also been in line with this. The EPS growing within a channel represented by two lines.

EPS_1

Fig 6 – Price and EPS movements

  • Total debt is Rs 4071 cr, and D/E high at 1.78. However this is a spike, required to acquire firms, and is expected to be reduced to manageable levels in the next 1-2 years.
  • Return on Capital Employed is 17.4% while Return on Net Worth is 19.4%. These are good ratios.
  • PE is 29.6 currently, and PEG based on PE and EPS growth is at 0.98 – indicates a fairly valued stock.

Benchmarking

In the benchmarking exercise we compare MSS with industry plays like Bharat Forge, Bosch and Exide.

Benchmarking

Fig 7 – Industry Benchmarking

  • With its acquisitions in the recent past, MSS leads in terms of revenue growth. The cost of acquisitions reflects in the high debt.
  • With good cash management, the revenue growth should soon reflect on the profits and debt reduction. Good inventory turnover means factory assets are being well utilized.

Financial Estimate

The business financials are projected in Fig 8.

Projections

Fig 8 – Financial Projections

  • In the next 2-3 years, MSS will consolidate its acquisitions, steady the new operations, grow business volumes and repay debt from cash flows.
  • The recent revenues jumps will soon translate into profit increases.
  • MSS forex revenues is a plus as the INR over 2-3 years will be stable or may even depreciate a little.

Risks

  • Current expectations are that the domestic market’s current slowdown will end in 1-2 quarters, but if it extends for a longer period, domestic investments will be affected.
  • Foreign Exchange volatility. MSS has 83% of revenues in non INR currencies. A significant portion of debt is also in Forex. We can see large unpredictable quarterly gains and losses due to this.
  • Economic environment needs to be stable in key markets of USA, UK, Europe, China and India.
  • Complex corporate structure of group with many cross holdings, JVs and subsidiaries across firms.

Opinion, Outlook and Recommendation

  • The global automobile market recovered significantly in 2013 from the impact of the global financial crisis, buoyed by economic recovery and pent-up demand in the U.S. and Asia.
  • The automobile sector in India has many unique advantages – good local small car demand and production, export momentum, presence of many global names and design skills. Clearly the auto ancilliary industry also incorporates all of these.
  • MSS is a visible, dynamic player in auto ancillaries. They started as a vendor for Maruti Suzuki, and built capability, corporate maturity and finally global growth from this strong base.
  • By all indications, MSS is a successful Indian auto ancillary firm that has made bold moves to grow internationally, acquire technologies, listen to their customers and manage manufacturing well.
  • While the PE at 29.6 appears high, we expect profits growth to exceed this over the next 2-3 years
  • MSS is a buy with a Mar 2016 price target of 451, a 104% appreciation from today (25 Feb’14).

————————————————————————

The JainMatrix Investment Service is available for a subscription fee. SUBSCRIBE NOW. 

To get more Services Details, See Offering
To Make the Payment, See Payment Options

JainMatrix Knowledge Base:

See other useful reports

Contact

  • Ask for a call back by filling FORM
  • Register Now to get our Free reports and much more, on the top right of this page, or by filling this Signup Form CLICK.

Disclaimer

This document has been prepared by JainMatrix Investments (JM) of Bangalore, India, and is meant for use by the recipient only as information and is not for circulation. This document is not to be reported or copied or made available to others without prior written permission of JM. It should not be considered or taken as an offer to sell or a solicitation to buy or sell any security. The information contained in this report has been obtained from sources that are considered to be reliable. However, JM has not independently verified the accuracy or completeness of the same. Neither JM nor any of its affiliates, its directors or its employees accepts any responsibility of whatsoever nature for the information, statements and opinion given, made available or expressed herein or for any omission therein.Recipients of this report should be aware that past performance is not necessarily a guide to future performance and value of investments can go down as well. The suitability or otherwise of any investments will depend upon the recipient’s particular circumstances and, in case of doubt, advice should be sought from an independent expert/advisor. Either JM or its affiliates or its directors or its employees or its representatives or its clients or their relatives may have position(s), make market, act as principal or engage in transactions of securities of companies referred to in this report and they may have used the research material prior to publication. Any questions should be directed to the director of JainMatrix Investments at punit.jain@jainmatrix.com

How The Economic Machine Works

Dear Reader,

Normally I send you a note, ask you to open your wallet and invest in a firm.
Today I am going to ask you to invest something more valuable …. your time.
This is a beautiful video showing How The Economic Machine Works, takes 30 minutes but very watchable. By Ray Dalio, a great American Fund manager.
It will show how Economic cycles affect our lives. I also believe that long term investments aligned with Economic Cycles can maximise investor returns.
Its worth your time.

Wishes and riches,
Punit Jain
JainMatrix Investments

JainMatrix Knowledge Base:

See other useful reports

Do you find this site useful?

  • Visit the SUBSCRIBE page to find how you can get more. Click LINK
  • Register Now to get our Free reports and much more, on the top right of this page, or by filling this Signup Form CLICK.

Disclaimer:

These reports and documents have been prepared by JainMatrix Investments Ltd. They are not to be copied, reused or made available to others without prior permission of JainMatrix Investments. Any questions should be directed to the director of JainMatrix Investments at punit.jain@jainmatrix.com

Also see: https://jainmatrix.wordpress.com/disclaimer/

Engineers India FPO – Buy

_____________________________________________________________________________

  • Report Date 11-Feb-2013
  • CMP: Rs 151
  • Mid Cap – with Mkt Cap of 5,113 crores
  • Pricing: Rs 145-150 range, Retail gets an additional Rs 6 discount
  • Issue Period: 6-12 Feb 2014
  • Advice: Buy

Here is a note on the Engineers India Ltd  FPO (EIL).

Introduction

  • EIL is a PSU engaged in engineering consultancy and turnkey implementation of petrochemical projects.
  • Its turnover in FY13 was 2,529 crores, with profits at 632 cr. Market Cap today is 5,113 cr, at CMP 151.
  • It has 2,890 employees. The focus was Oil and Gas projects, but EIL is diversifying into new sectors like Fertilizer and LNG, Non-ferrous metallurgy, Infrastructure and Nuclear and solar energy.
  • The Delhi based firm is expanding from mostly Indian projects, to execution in MENA (middle east North Africa) and South East Asia. Additionally, offices in London, Milan and Shanghai are for international procurement and marketing.
  • The divestment of 10% of EIL shares is going on through the FPO process.

 Price Snapshot

EIL Price Profile, JainMatrix Investments

EIL Price Profile, JainMatrix Investments, Click to enlarge any image

  • Investors in EIL over the last 5 years have seen an 11% appreciation in the share price. However, the high of Rs 538 occurred in 2010 when a share split and bonus was announced. Thereafter the share has fallen steadily.
  • The dividend at 120% on a FV of 5, provides a dividend yield of 4%.
  • EIL is today available at 2009 price levels.

Financials

EIL Financials, JainMatrix Investments

EIL Financials, JainMatrix Investments

  • The Revenues, EBITDA and Profits have grown at 25%, 17% and 17% over the last 5 years. But there has been a  fall in the recent year, of FY13.
  • We can see that FY12 was a peak year with a number of projects completed here. Business appears to be falling from here. (The FY14 number is only for first 3 quarters).
EIL Business Segments, JainMatrix Investments

EIL Business Segments, JainMatrix Investments

  • Business revenues consists of Consulting and Turnkey segments. The former is steady while the latter is cyclical and dependent upon the projects completed.
  • Margins are steady and high for Consulting, but lower and variable for turnkey, dependent on the execution.
EIL Cash Flow, JainMatrix Investments

EIL Cash Flow, JainMatrix Investments

  • Cash flow has been positive but lumpy and variable.
  • Current P/E is 8.05 times, the lowest in the last 5 years.
  • Debt is zero, and cash on hand is 1848 cr (FY13). This translates to Rs 55 per share of cash.
  • A key ratio is Orders Booked to Revenues Billed. A view of this shows that the ratio is at the best level for the last 4 year period.
  • ROCE and RONW are high at 39% and 28% respectively. This is a positive indicator.
EIL Booked to Bill Ratio, JainMatrix Investments

EIL Booked to Bill Ratio, JainMatrix Investments

FPO Offer and Subscription Status

  • The IPO price band is 145-150 per share; Issue period for Retail is Feb 6-12, 2014.
  • The government holding will fall from 80% to 70%. It is selling this to meet its FY14 divestment targets.
  • As per data available till EoD Feb 10th, the offer is already 1.44 times oversubscribed. The breakup is QIB 2.33 times, Non Institutional investors 0.01 times and Retail 0.84 times.
  • P/E at upper end for the Retail offer is 7.7 times FY13.  

Overall Opinion

  • The Oil and Gas sector of India is still PSU dominated. EIL is a preferred vendor in this segment.
  • EIL is also growing rapidly in new sectors and geographies.
  • Our view is that this sector will start to do well over the next 2-3 years and EIL will be an early gainer in this revival.
  • By all indicators, in the next 2 days ie 11-12 Feb, the offer should be well oversubscribed.
  • Based on all this, EIL in this FPO is a good contrarian, value buy.
  • Investors need to have a longer 2-3 year perspective.  

Do you find this site useful?

  • Visit the SUBSCRIBE page to find how you can get more. Click LINK
  • Register Now to get our Free reports and much more, on the top right of this page, or by filling this Signup Form CLICK.

Disclaimer

This document has been prepared by JainMatrix Investments Bangalore (JM), and is meant for use by the recipient only as information and is not for circulation. This document is not to be reported or copied or made available to others without prior permission of JM. It should not be considered or taken as an offer to sell or a solicitation to buy or sell any security. The information contained in this report has been obtained from sources that are considered to be reliable. However, JM has not independently verified the accuracy or completeness of the same. Neither JM nor any of its affiliates, its directors or its employees accepts any responsibility of whatsoever nature for the information, statements and opinion given, made available or expressed herein or for any omission therein. Recipients of this report should be aware that past performance is not necessarily a guide to future performance and value of investments can go down as well. The suitability or otherwise of any investments will depend upon the recipient’s particular circumstances and, in case of doubt, advice should be sought from an independent expert/advisor. Either JM or its affiliates or its directors or its employees or its representatives or its clients or their relatives may have position(s), make market, act as principal or engage in transactions of securities of companies referred to in this report and they may have used the research material prior to publication. Any questions should be directed to the director of JainMatrix Investments at punit.jain@jainmatrix.com