Godrej Properties – A Towering Success

——————————————————————————————————————–

  • Date: 12th Jan 2015
  • CMP: 253, PE: 28.4 times
  • Mid Cap with mkt cap 5,080 cr.
  • Advice: Medium Risk. Buy for minimum 2 year holding.

Overview:  GPL is a premium end player in housing, commercial and township real estate with a national footprint. It has a good record of projects, and a lean, asset light and productive business model. Revenues, EBITDA and Net Profit have grown by 37%, 25% and 16% CAGR over the last 6 years.

Why Buy Now: 1) The sector is emerging from some poor sentiment and is likely to benefit from economic revival. 2) GPL is a sector leader in terms of transparency, low debt and an asset light model. 3) There are signs of business acceleration at GPL which will be visible over the next two years. 4) GPL is currently at low historical valuations, and a likely mean reversion also points to a share appreciation

Godrej Properties – Description and Profile

  • Godrej Properties Limited (GPL) is a Mumbai based real estate firm and part of the Godrej Group.
  • Established in 1990, GPL had FY2014 revenues of Rs 1254 crore and profits Rs 154 cr.
  • It is developing residential, commercial and township projects across 9.3m sq.m. (100 m sqft.) in 12 cities.
  • Leaders are Adi Godrej (Chairman) and Pirojsha Godrej, MD & CEO.
  • It has 601 employees, an increase of 40% in FY14.
  • GPL has an asset light and capital efficient development model. It owns only 15% of the land it is developing, and partners with land owners by sharing in either revenues, profits or the constructed area, in a JV model.
  • In its commercial portfolio, it builds office space catering to blue-chip Indian and international companies and IT parks catering to the requirements of IT/ITES companies and retail space.
JainMatrix Investments

Fig 1 – GPL operations and Bookings, Source: GPL website (click on image to expand)

  • ICRA has upgraded long-term rating of GPL to AA- from A+.
  • Shareholding pattern in percentage is Promoter 75, MFs/DII 1.5, FIIs 11.5, Individuals 8.1, Corporates 3.1 and Others 0.8

Business Strategy

  • The GPL strategy is detailed in Fig 2, with which they have created a unique business model. Land ownership is mostly with partners, so operations are asset light.
  • GPL carries out project level equity dilution to mitigate risk and remain capital efficient.
  • Outsourcing of architecture and construction to good vendors ensures a lean structure and operations.
  • The strong Godrej brand is utilized and extended by GPL. The Corporate Governance is strong too.
Godrej Properties, JainMatrix Investments

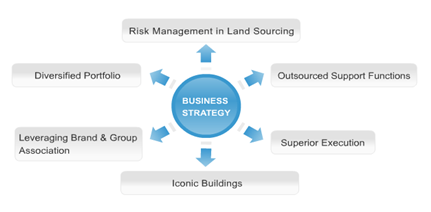
Fig 2 – Business Strategy, Source: GPL website

  • The CII – Sohrabji Godrej Green Business Centre (a group company) has expertise in offering advisory services to the industry in the areas of green buildings, energy efficiency, water management, environment management, renewable energy, green business incubation and climate change activities.
  • GPL is also tasked with developing the large land bank of the Godrej group. They are among the biggest land owners in Mumbai.

Recent Events and Awards

  • GPL’s blended average selling price of real estate all India in Q4FY14 was Rs 8000 psf.
  • Business acceleration: GPL has started 18 projects in the last 10 quarters with 23.8m sqft. saleable area. In Q4FY14, it saw the highest ever sales in a single quarter – of over Rs 1,000 cr. Further, GPL may launch 15-16 residential projects in FY15, a good acceleration.
  • GPL successfully concluded a rights issue in Aug 2013 to raise Rs 700 cr. It issued 8 shares for every 29 shares held by shareholders at Rs 325 apiece, a discount of about 30% to the then market price.
  • GPL is the first real estate company in India to have ISO certification.
  • They have received over 50 awards received in the past 5 years. The Godrej Garden City project of GPL is one of only two projects in India and 16 worldwide to be chosen by The Clinton Foundation to partner with them in the goal of achieving climate positive development.
  • Great Places To Work – GPL was ranked 1st in the Real Estate and Construction sector in 2014; Ranked amongst top 25 companies to work for in India for the second consecutive year in 2014; The Aon Hewitt Employee Engagement Study measured that the GPL employee engagement score increased to 81% in 2013, from 79% in 2012 and 67% in 2011.
  • GPL has entered into an agreement with a land owner to develop an affordable housing project at Badlapur, near Mumbai. The project will have 1.3 million sq ft of saleable area.

Industry Notes

  • Real estate sector plays a crucial role in the Indian economy, contributing to 5-6% of the country’s Gross Domestic Product (GDP). It is the second largest employment generating sector after agriculture.
  • Apart from generating direct employment it also stimulates the demand in over 250 ancillary industries such as cement, steel, paint, brick, building materials, furniture, consumer durables, fittings, etc.
  • Rapid urbanization, positive demographics, growing nuclear families, infrastructure development, rising income levels and growing housing demand so far have driven real estate development in India.
  • There will be a shortage of 7.55 cr. residential units by 2014 end (CRISIL). Commercial demand is highly correlated to the GDP of the country, with recent falls in growth adversely affecting demand.
  • In current Industry scenario, the decline in demand is due to deteriorating macro-economic factors such as increasing prices, and recent regulatory changes (pertaining to development control rules), have led to prolonged period of lull for the sector.
  • Despite these headwinds, the $70-75 billion Indian real estate market size is expected to touch $180 b by 2020, while FDI in the sector is expected to increase to $25 b in 10 years from present $4 b.
  • GPL is fourth ranked of 26 listed Real Estate – Construction & Contracting firms (on NSE) by market cap. Further, its market cap gives it a 5% share of this universe. (Note – this does not include Civil and Housing focused Construction and Contracting firms, and also unlisted firms).
  • Budget 2014: the govt. announced relaxed norms for FDI in real estate, which will give a huge boost to housing projects. The Centre eased criteria for FDI by reducing the minimum size of projects from 50k sq. m. to 20k sq. m. and investment in projects from US$ 10m to US$ 5m (Rs 30 cr.)
  • The budget also allowed (tax) pass-through status to real estate investment trusts (REITs). REITs allow small investors to own a share in big expensive commercial properties. This is expected to drive substantial investment demand into commercial property.
  • The industry is overall poorly regulated and there are few norms around housing project launch, sale and execution by developers. Bank funding for developers has been a challenge, due to poor loans performance (by the sector) in the past. Hence debt costs are higher for developers.
  • The Real Estate Regulation and Development Bill, 2013 aims to bring in a high level of transparency in real estate transactions and projects in India. It proposes setting up a Real Estate regulator to cover commercial and residential real estate segment. It is being piloted by the ministry of GoI.

Stock Valuation, Performance and Returns

JainMatrix Investments, Godrej Properties

Fig 3 – Pricing History

  • Pricing history – Since the IPO in Jan 2010 at Rs 245 (adjusted for a split), the share price of GPL rose to a peak of 393 in July 2011. It then fell to a bottom of 154 in Jan 2014, helped along by a rights issue in Aug 2013 and share split in Nov 2013, before rising sharply to today’s CMP of 253. See Fig 3.
  • Investor returns for the IPO investors is +1.0% of IRR over 5 years. However IPO investors who added shares in the Rights issue of 2013 have a slightly better IRR.
  • But the GPL financials show a fine growth with Revenues, EBITDA and Net Profit growing by 37%, 25% and 16% CAGR over the last 6 years. EPS has also grown by 17% in this period. This lower growth is explained by the dilutions and capital raising undertaken to fund the growth. See Fig 4.
  • Annual revenues peak in Q4. As volumes increased, the Operating margin has shown a dip. But even as the EPS has increased, the Debt / Equity ratio has been in control, even improving.
JainMatrix Investments

Fig 4 – Quarterly Financials

JainMatrix Investments

Fig 5 – Cash Flow and Financial Ratios

  • FCF (Free Cash Flows) has mostly been negative except in the FY13. See Fig 5. This business definitely needs cash up front and is a long gestation projects business.
  • The Price and PE Chart Fig 6, shows that the PE has historically been in a range of 25-65 times over the last 6 years. This area can be broken into 4 quartiles.
  • Today the valuations for GPL are attractive as the PE is in the lowest quartile. The PE (TTM) is 28.4 times.
JainMatrix Investments

Fig 6 – Price and PE Chart

JainMatrix Investments

Fig 7 – Price and EPS Chart

  • Price and EPS chart Fig 7, shows that inspite of some volatility in EPS, the overall trend is a rising channel with some recent acceleration.
  • The Orders Booked to Billings ratio has stayed over 2, indicating a good pipeline of Orders. Fig 8.
  • The Beta of GPL is 0.86 which shows the low volatility as compared to the indices (Reuters).
  • The company has an interest coverage ratio of around 65 times which is good.
  • ROCE and RONW are in 7.7 and 9.9 respectively, which is an average level.
  • PEG is at 1.2 – indicates it is currently fairly valued.
JainMatrix Investments

Fig 8 – Orders Booked to Billings

Peer Benchmarking and Financial Projections

Here is a benchmarking exercise of GPL with its peer companies DLF, Oberoi Realty and NBCC.

  • The PE comparison indicates relative undervaluation. The Price To Book value however is high, as its book value is low due to the asset light model.
  • GPL is also higher in terms of 3 years CAGR sales, 3 years CAGR Profit and ROE among its listed peers, which is a positive sign.
  • NBCC shows some good metrics but signs of being overvalued.
Fig 9, 10 – Peer Benchmarking and Financial projections

Fig 9, 10 – Peer Benchmarking and Financial projections

We have projected the 2 year financials for GPL.

Risks:

  • Sector risk: The Real Estate industry in India is a high risk sector due to poor land records, opaque land use conversion rules and process, and multiple development approval requirements. GPL has however reduced these risks by an asset light partnering approach.
  • Business Model risk: There is high volatility in funding and cash flows for GPL. Real Estate project investments are front ended, while revenues are back ended for the 2-4 year project life cycle. Risks here include cash flow challenges, project funding availability and high cost of unsold inventory.
  • Economy risk: Demand is dependent on GDP growth, but the economy has slowed over 3-4 years.
  • Outsourcing risk: By outsourcing the construction activities, the final product quality depends upon the vendors. Thus vendor execution standards & consistency (risk) needs constant monitoring.
  • Regulatory risk: The central government is making attempts to govern, monitor and regulate the real estate sector for project transparency, public launch requirements, complaint monitoring, delays, etc. Any new rules, regulations and compliance requirements will affect the business of GPL.
  • Competition is intense, particularly in high end residential real estate sector.

Opinion, Outlook and Recommendation

  • There will continue to be a shortage of housing from a 10 year perspective. The regulatory environment for this sector will improve over the next 2-3 years, as the new government at the center brings in reforms and improves the ease of doing business. The economic cycle in India too is recovering from a bottom of 4.6% GDP growth recently. This will have a positive effect on GPL.
  • GPL is expanding its execution capabilities and brand strength in an all India manner, by both exploiting the land assets of the Godrej group, as well as partnering with land owners for projects.
  • The asset light, and partnering with the best vendors, approach is proving to be a good strategy.
  • GPL is in the midst of a business acceleration that will be seen over the next 2-3 years.
  • GPL is a BUY. Invest now and systematically to gain from long-term outperformance.

JainMatrix Knowledge Base:

See other useful reports

Visit and Like on  Facebook or Follow on Twitter for reports

Check back on this website for updates.

Do you find this site useful?

  • Visit the Investment Service page to find how you can get more. Or Click LINK
  • Register Now to get our Free reports and much more, on the top right of this page, or by filling this Signup Form CLICK.

Disclaimer:

This document has been prepared by JainMatrix Investments Bangalore (JM), and is meant for use by the recipient only as information and is not for circulation. This document is not to be reported or copied or made available to others without prior permission of JM. It should not be considered or taken as an offer to sell or a solicitation to buy or sell any security. The information contained in this report has been obtained from sources that are considered to be reliable. However, JM has not independently verified the accuracy or completeness of the same. Neither JM nor any of its affiliates, its directors or its employees accepts any responsibility of whatsoever nature for the information, statements and opinion given, made available or expressed herein or for any omission therein. Recipients of this report should be aware that past performance is not necessarily a guide to future performance and value of investments can go down as well. The suitability or otherwise of any investments will depend upon the recipient’s particular circumstances and, in case of doubt, advice should be sought from an independent Financial Expert/Advisor. Either JM or its affiliates or its directors or its employees or its representatives or its clients or their relatives may have position(s), make market, act as principal or engage in transactions of securities of companies referred to in this report and they may have used the research material prior to publication. It is safe to assume that if the JainMatrix website recommends a stock, the researcher has already invested in it. Punit Jain has owned (long only) GPL since Mar 2014. JM and employees do not seek or receive remuneration in any form for any service from the firms researched. Any questions should be directed to the director of JainMatrix Investments at punit.jain@jainmatrix.com.

MidCap Portfolio – Celebratory Outperformance

—————————————————————————————————————————

Date: 25th Dec 2014

JainMatrix Investments Mid & Small Cap Model Portfolio: Monthly Update

In this, our last report of 2014, we wish our Subscribers and Readers a Merry Christmas and a Happy New Year. Its time to be grateful for the wonderful gifts of 2014.

We also present readers with the Celebratory results of our Mid & Small Cap Model Portfolio, where we outperformed the benchmarks by an annualized 54%.

We present the Dec 2014 update on this portfolio, with a refresh of key data.


Our portfolio is only shared with Subscribers. 


Portfolio Objective, Theme and Performance

  • JainMatrix Investments launched its Mid and Small Cap portfolio in Feb 2013.
  • The objective of the MSCMP is to outperform the Mid and Small Cap indices by large margins.
  • It consists of 7 mid & small cap firms that are out-performers from identified 3-5 sectors.
  • Firms are introduced into the MSCMP with a minimum holding period of 1 year.


Embed from Getty Images


  • The current investment theme is – IT services, Auto ancillaries, NBFCs, infrastructure and rural/ semi urban consumption.
  • In a mildly corrective environment of Dec 2014, the portfolio performed well. On average the active portfolio shares were up by annualized 83.9%.
  • The CNX Midcap, BSE Midcap and BSE Smallcap were up by 25.6%, 24.6% and 29.7% on an annualized basis over 23 months. These have fallen mildly in the last month.
  • The JainMatrix Investments active Mid & Small Cap Model Portfolio outperformed the indices by 54.2%.

  • The investor should continue his investing process with the MSCMP in a SIP mode.

Some previous updates for the JainMatrix Investments Mid and Small Cap Model Portfolio

Not a subscriber? Sign up for a JainMatrix Investments subscription to help navigate your investment journey. Visit  Subscribe

Do you find this site useful?

  • Visit the Investment Service page to find how you can get more. And click LINK
  • Register Now to get our Free reports and much more, on the top right of this page, or by filling this Signup Form CLICK.

Disclaimer

This document has been prepared by JainMatrix Investments Bangalore (JM), and is meant for use by the recipient only as information and is not for circulation. This document is not to be reported or copied or made available to others without prior permission of JM. It should not be considered or taken as an offer to sell or a solicitation to buy or sell any security. The information contained in this report has been obtained from sources that are considered to be reliable. However, JM has not independently verified the accuracy or completeness of the same. Neither JM nor any of its affiliates, its directors or its employees accepts any responsibility of whatsoever nature for the information, statements and opinion given, made available or expressed herein or for any omission therein. Recipients of this report should be aware that past performance is not necessarily a guide to future performance and value of investments can go down as well. The suitability or otherwise of any investments will depend upon the recipient’s particular circumstances and, in case of doubt, advice should be sought from an independent Financial Expert/Advisor. Either JM or its affiliates or its directors or its employees or its representatives or its clients or their relatives may have position(s), make market, act as principal or engage in transactions of securities of companies referred to in this report and they may have used the research material prior to publication. Any questions should be directed to the director of JainMatrix Investments at punit.jain@jainmatrix.com

A Meetup organised by JainMatrix Investments

——————————————————————————————————–

Dec 13, 2014

JainMatrix Investments organised a Meetup in Bangalore on 13th December 2014 entitled – “Financial Education and Wealth Creation – an open discussion.” The event focused on offering insights that helped in managing finances in today’s tough economy, and creating, building and sustaining wealth.

Event snap

During the event a presentation on the equity opportunity, current trends in the economy and a snapshot of the equity service by JainMatrix Investments were made by Mr. Punit Jain, the founder of JainMatrix Investments.

Various other topics like Wealth, Income, Finance, and Mobile based Education modules were also discussed by Mr. Mohan Krishna Rao in the event.

The event was well attended and there was a rich interaction and lively discussions on Finance, Wealth, Stock Markets, Inflation, etc.

See this link with photos of the event.                             LINK

If you want to be a part of these Meetups, future events, announcements and perhaps even live online interactions, feel free to write to us!! You are most welcome and we will be delighted to have your presence.

Regards,

Punit Jain

 JainMatrix is Social

Do you find this site useful?

  • Visit the Investment Service page to find how you can get more. Or Click LINK
  • Register Now to get our Free reports and much more, on the top right of this page, or by filling this Signup Form CLICK.

Top performing sectors in 2015 – An Interview

———————————————————————————————————–

Excerpts from my recent interview with IndiaNotes: 

Punit Jain, JainMatrix Investments

Punit Jain

Q: What is your view on the Indian equity markets? Is the correction due or we could see a continuation in the bull run? Please provide your long term perspective on the markets?

Punit Jain: In December we expect a mild correction where the market takes a breather. The Sensex move from 20,300 on 7th Feb 2014 to 28,800 on 28th Nov has been a 42% gain over 9 months almost without a break. All big gains are interspersed with small corrections (and the converse). Plus there is a year end (book your gains) angle for FIIs. But the market will revive in Jan 2015. The long term perspective is a 15-20% annual gain in markets over the next 3 years. This adds up to a 43,000 Sensex by Dec 2017. 

Q: Top 5 stocks you would place your bets on in 2015? Why? Which sectors do you think would be the top performers in 2015? 

Punit Jain: I cannot be stock specific in my commentary, but the sector leadership and the theme for our portfolios is IT Services, Auto and Auto Ancilliary, Banks, NBFCs, Housing and rural/ semi urban consumption. All the top bets would be from these identified sectors. 

Q: What is your take on Kotak Mahindra and ING Vysya Bank merger? Could we see more mergers in the banking sector?         

Punit Jain: Kotak Mahindra Bank was at one stroke able to almost double its branch strength and grow its retail presence. It is thus set to be a much bigger and stronger Bank. All the larger private banks are looking at aggressive growth, both organic and inorganic. There may certainly be more such mergers in the future. It is just a matter of a bank asset being available on the market at the right valuations.

Embed from Getty Images

Q: With global crude oil prices plummeting, is it the right time to invest in Oil companies?

Punit Jain: Its a mixed bag for the Oil & Gas sector.

  • The oil marketing companies will see falling prices at the pump, and subsidies have been withdrawn for many of the petro products. This will help them strengthen financially and their valuations should improve. (Positive)
  • The E&P Oil firms will suffer as the oil produced was benchmarked against international crude prices. Their revenues will be hit. (Negative).
  • The oil refiners will enjoy good margins and the oil prices do not affect them, they pass on any oil price changes. However the demand is falling abroad, so exports volumes may be affected. Domestic demand will be good. (Neutral to Positive).

Q: What is your take on SEBI norms for independent research analysts?  

Punit Jain: Its a very good initiative by SEBI. Speakers on national TV or newspapers will have to be careful about their words and ensure they comply with the norms. I think we will see the emergence of a better quality of research reports and communication. Its better for Investors.

This interview has been published simultaneously on IndiaNotes, at LINK.

V-Guard Industries – Electrifying Growth

——————————————————————————————————————–

  • Date: Dec 11th, 2014
  • CMP: 1095 and P/E: 41.5
  • Mid Cap: with mkt cap 3200 cr.
  • Industry: Consumer Electricals and equipment
  • Advice: Downgraded to a Hold due to excessive valuations

We first published this for Subscribers on 10 Sept 2014. The share has appreciated 38% in 3 months. Sign up for the Investment Service to get the latest valuable reports. 

  • Visit the Investment Service page to find how you can get more. Or Click LINK
  • Register Now to get our Free reports and much more, on the top right of this page, or by filling this Signup Form CLICK.

V-Guard is a small manufacturer of household electricals like voltage stabilizers, UPS, pumps, water heaters, cables, ceiling fans, etc. After success in South India, it is rolling out nationally. Strengths include strong brand, good R&D and smart manufacturing and sourcing operations. It’s a high demand sector, with growth prospects due to affluence and rising no. of households. Revenues, EBITDA, Profits and Share Price grew at 33%, 27%, 11% and 42% CAGR over last 7 years. The share has given 16X gains since March 2008. Risks include high valuations, national scaling challenges and crowded new product categories.

V-Guard Industries – Profile

  • V-Guard Industries (VGI) is a Kerala based firm into electrical equipment for households.
  • Revenues in FY14 were Rs 1,518 crores and profits Rs 70 cr. Market Cap is 3,200 cr.
  • Started in 1977, with voltage stabilizers, it has expanded its product segments, see Fig 1.
  • VGI has 1599 employees and a network of 407 distributors, 4,344 channel partners and 25,000 retailers across the country. It has factories in Coimbatore and Perundurai (TN), Kashipur (Uttarakhand), and Kala Amb (HP), but VGI also has a smart outsourcing strategy for production.
  • Key Executives are: Kochouseph Chittilappilly (Chairman), Mithun Chittilappilly (MD) and V. Ramachandran (Director Marketing & Strategy).
  • Shareholding pattern % is: Promoters 66.2, FI/FII 19.0, Individuals & HNI 9.3, MFs 4.1 and Others 1.4.
  • The successful IPO of Wonderla Holidays, a sister company is a feather in the cap of this group.
VGuard Products, JainMatrix Investments

Fig 1 – V-Guard Products (click image to expand)

Product Notes

The product range is depicted by Fig 1, while the product revenues of FY14 are in Fig 2.

  • House Wiring Cables: This is the largest product segment of VGI. The demand in the market is high and the firm is going ahead with a capacity expansion at the Kashipur Plant.
  • Voltage Stabilizers: This is VGI’s flagship product and continues to be one of the largest contributors to revenue and profitability of the Company. Revenues are directly related to white goods sector.
  • Pumps and Motors: This is one of the established segments for VGI contributing to major parts of sales. VGI continues to enjoy premium pricing over competition in the Southern markets.
  • Digital UPS: The digital UPS segment has been the fastest growing segment for VGI. Increased brand penetration for the product, coupled with the frequent power outages in most parts of the country has driven the growth for this segment.
  • Fans: VGI launched fans in 2006 and has more than 30 models with variants of ceiling, pedestal, table, wall, ventilating and exhaust fans. The overall fan market is expected to witness sharp expansion going forward on the back of strong expected growth in the housing sector.
V-Guard Product Revenues, JainMatrix Investments

Fig 2 – V-Guard Product Revenues

  • Other revenue segments of VGI business constitutes of LT Cables, Electric Water Heaters, Solar Water Heaters, Desktop UPS, domestic switch gears and induction cookers.
  • VGI has built its presence in the kitchen appliance category by launching mixer grinder (in 2014) and induction cooker (2013), and both have been well accepted in the market. The launch of Pebble, its new range of water heaters, was successful. It also unveiled Enviro, a hi-speed pedestal fan.

Business Notes

  • Management: The first generation entrepreneur Kochouseph Chittilappilly started this company from scratch in 1977. They later diversified into amusement parks, and Wonderla Holidays is now run by Arun Chittilappilly, his brother. His son Mithun joined VGI in 2004, and is now the MD. The Vice Chairman is Cherian N. Punnoose, an experienced CA and professional. The Director-Marketing & Strategy is V. Ramachandran, ex LG and HUL. Thus VGI may have stepped beyond a family business and has professionalized management, a necessary condition for stability and growth.
  • Vision: The leadership has a vision to become No. 3 player in each category in the next 3-4 years.
  • The VGI brand is strong, particularly in South/Kerala, and is now expanding all India. Fig 3.
  • VGI has expanded beyond the initial success of voltage stabilizers into related UPS, then house wiring cables, pumps and motors and household devices like fans, water heaters, etc. Fig 1 and 2.
Sales Distribution, JainMatrix Investments

Fig 3 – Sales Distribution

  • VGI owns two wind energy converters type E30 at Erode in Tamil Nadu with a capacity of 230 KW. Currently it produces 13 lakh units per annum, which is transferred to the state electricity grid.
  • Manufacturing: Considering the strong demand for wires, VGI has decided to double the capacity at the Kashipur plant in Uttarakhand from 3.3 million coils per annum to 6.6 million coils per annum in two phases. The investment for this was Rs 18 cr. VGI’s new plant for producing solar water heaters at Perundurai TN has gone on stream in 2013, with annual capacity of 90,000 solar water heaters.
  • It has an asset light model, and outsources more than 60% of its production.
  • Operational improvements in FY14 included reduction in its working capital cycle (by 8 days to 76), improvement in inventory days by 8 days and debtor days by 2 days, generating good cash flows.
  • R&D: VGI’s R&D Centre in Kochi was certified by the central govt’s Dept. of Scientific and Industrial Research (DSIR). Good R&D has reduced power consumption and improved products continuously.
  • VGI has recently won the ‘Innovative 100’ Awards 2013 hosted by Inc. India magazine, for the brand’s constant effort to bring in smart innovations in their product categories.
  • Advertising: VGI spent around 58 cr. (4.3% of revenues) on advertising in FY13, then increased it marginally in FY14 to 60 cr. (3.9%). Most of the expenditure in FY14 was targeted at the IPL.
  • Ad spends are to be maintained at 3.5-4% of revenues in FY15 as well.

Business Challenges:

  • Competition: In recent few years VGI has faced competition from Honeywell Automation, Genus Power Infra and Pearl Electronics. BEL is the largest player in electronics components in India. Havells is a large player in house wiring cables and fan segments in Non South regions.
  • Fans, heaters and kitchen appliances are established categories with organized and unorganized sector competition.
  • Many of the products have a negative correlation to overall development. The core voltage stabilizers product is threatened by improved power delivery by electricity utilities. It is also challenged by fridges and ACs bought pre-fitted with stabilizers.
  • Laptops and tablets too do not require UPS due to in-built chargeable batteries.
  • Seasonality affects demand – pumps, motors and stabilizers depend on rainfall and power supply.

Stock Evaluation, Performance and Returns

  • The price and dividend history (LINK) has shown a fine growth since it got listed in Mar’08.
  • The share is currently at its all-time high range. Dividend too has grown steadily in the last 7 years.
  • Revenues, EBITDA, Profits and Market Price grew at 33%, 27%, 11% and 49% CAGR over last 7 years.
  • Profit appears low only due to a high base effect in FY08. See Fig 4.
Quarterly Financials, JainMatrix Investments

Fig 4 – Quarterly Financials, by JainMatrix Investments

  • Revenues growth has been excellent, while the operational and profit margins are flat. The EPS has surged due to the volumes growth.
  • In addition, good operational decisions like more sourcing v/s in-house mfg have kept costs in check.
  • The Free Cash Flow has been positive in only 2 of the last 7 years. Fig 5. However the operational Cash Flow has been positive for 4/7 years. Investments have been made into capacity expansion and factories. The recent years show FCF is much higher. This is positive.
  • The historical average for PE of VGI is 20 times, and a range of 10-30 times over 7 years. See Fig 6.
  • The price chart shows an accelerating rise. The PE too is at 41.5 times, at all-time high levels. Thus it appears that VGI is overpriced at these levels.
  • The EPS for VGI peaked in Mar ’13 but has crossed these levels in the Q2FY15. See Fig 7.
Cash Flow and Dividend, JainMatrix Investments

Fig 5 – Cash Flow and Dividend, by JainMatrix Investments

Price, PE and EPS, JainMatrix Investments

Fig 7/8 – Price, PE and EPS, by JainMatrix Investments

  • ROCE and ROE are 26.1% and 24.2% respectively which is positive for the company.
  • The D/E of the firm has fallen to 0.47 (Q2FY15) from 0.6 (FY13), a good improvement.
  • Price to Book Value is at 10.3 (Q2FY15), which is high, but a sign of high insourcing of products.
  • PEG is 1.96 times, indicating high valuations.

Do you find this site useful?

  • Visit the Investment Service page to find how you can get more. Or Click LINK
  • Register Now to get our Free reports and much more, on the top right of this page, or by filling this Signup Form CLICK.

Benchmarking and Financial Estimates

We present a benchmarking exercise with listed peers in similar product categories.

VGuard Benchmarking, JainMatrix Investments

Fig 9 – Benchmarking, by JainMatrix Investments

  • VGI has excellent growth, returns and D/E characteristics.
  • Current Valuations are high, but overall VGI does fairly well in the comparison.

Financial Projections

We have carried out a financial projections exercise for VGI.

Fig 11 - VGuard Projections, JainMatrix Investments

Fig 11 – Financial Projections, JainMatrix Investments

Risks and Challenges

  • VGI has high brand recall in Kerala and Southern states. Future growth is dependent upon VGI being able to repeat and roll out its brand and distribution success nationally.
  • Dependency on the seasons like rains and summer. Here variations are getting worse every year.
  • Dependency on poor state electricity distribution for voltage fluctuations. This may improve slowly.
  • High competition in newer product categories like kitchen appliances, fans, geysers, etc. In particular VGI has to stay away from well-established global categories like computers, audio and audiovisual.
  • Volatility in raw material prices could impact margins in case cost escalations cannot be passed on to consumers.

Overall Opinion, Outlook and Recommendation

  • Strong brand that can be well leveraged for new products in South and all products in Non South.
  • Management that has grown businesses with good ambition, corporate governance and shareholder rewards.
  • Demand drivers for VGI include India’s rising population & affluence and the switching of consumers from unorganized sector to VGI products. These trends should drive demand for VGI products, even as competition in these categories intensifies.
  • The growing housing /real estate market can boost overall demand. Massive growth opportunities exist across household electrical and semi-electronic gadgets and equipment.
  • Robust distribution and dealer network setup in South that is being replicated across the country.
  • However at a PE of 41.5, PEG of 1.96 times and PB of 10.3 times, we feel valuations are stretched.
  • VGI is a Hold today due to excessive valuations.

JainMatrix Knowledge Base:

See other useful reports

Do you find this site useful?

  • Visit the Investment Service page to find how you can get more. Or Click LINK
  • Register Now to get our Free reports and much more, on the top right of this page, or by filling this Signup Form CLICK.

Disclosures and Disclaimer

  • This document has been prepared by JainMatrix Investments Bangalore (JM), and is meant for use by the recipient only as information and is not for circulation.
  • JM has been publishing equity research reports since Nov 2012.
  • Punit Jain has been a long term investor in VGI since Oct 2014. Other than this JM and its promoters/ employees have no financial interest in VGI and no known material conflict of interest as on date of publication of this report.
  • This document is not to be reported or copied or made available to others without prior permission of JM. It should not be considered or taken as an offer to sell or a solicitation to buy or sell any security.
  • The information contained in this report has been obtained from sources that are considered to be reliable. However, JM has not independently verified the accuracy or completeness of the same.
  • Neither JM nor any of its affiliates, its directors or its employees accepts any responsibility of whatsoever nature for the information, statements and opinion given, made available or expressed herein or for any omission therein.
  • Recipients of this report should be aware that past performance is not necessarily a guide to future performance and value of investments can go down as well. The suitability or otherwise of any investments will depend upon the recipient’s particular circumstances and, in case of doubt, advice should be sought from an independent expert/advisor.
  • Any questions should be directed to the director of JainMatrix Investments at jain@jainmatrix.com

The Toughest Lesson in Long Term Investing

————————————————————————————————–

Dear Investor,

I often ask myself why people find it so difficult to invest for the long term in the stock market. There are so many trading and demat account holders in India. But so few who are successful investors. My thoughts on this:

1) The Trading versus Investing approaches

These two approaches are so different that perhaps the first step for a new investor is to try to understand both these concepts and decide which approach he should start with.

  1. Trading is the purchase (or sale) of a stock to take advantage of a short term rise (or fall) of the price to make a profit. The ‘short term’ referred to here ranges from a few minutes to a few weeks.
    • Inherent in this approach is the need to ‘track your trade continuously’ and to ‘understand price, volume patterns’, a subject well understood by a Technical Analyst.
    • The lure of a quick buck attracts a lot of people to trading. The flip side is that there is a big learning curve, and my guess is that 5% of traders make large profits (with learning, luck, experience and the right attitude) while 95% walk away with varying degrees of losses.
    • My conviction is that Trading is a zero sum game. So for a particular stock, Profits (by winners) + commissions + taxes = Losses (by losers).
  2. Investing is the purchase of part ownership of a business, to have a share in the success of this firm, reflected in terms of revenue and profits (at the corporate level) and dividends and share price appreciation (at the shareholder level). It is generally made for the medium to long term.
    • Inherent in this approach is the need to find a company to invest in that is in a growing sector/ industry. It must have good management, that is transparent about their initiatives, financials and challenges. It must be Undervalued (cheap at the time of buying).
    • This subject is well understood by a Fundamental Analyst. (Disclosure: JainMatrix Investments is focused on Fundamental Analysis for stocks).
    • Investing typically needs the investor to allocate his money for at least 6 months, but more likely 2 years or longer. Thus investors need to have patience and this much time on hand.
    • My conviction is that Investing returns from a good portfolio give an exponential gain over time. See Fig 1. The graph illustrates how exponential growth (green) surpasses both linear (red) and cubic (blue) growth.
    • JainMatrix Investments

      Fig 1 – Exponential growth

    • In Investing, when there is a success, all shareholders win and profit. Its not a zero sum game. Its actually a meritocracy where the best performing listed corporates spawn the best rewarded shareholders.
    • In the long run, on average Indian equities (and Indices) have given 12-14% returns per year.
  3. My personal conviction is that someone new to the markets must enter as an investor and learn his lessons over a few quarters before trying his hand at trading. He soon realizes the power of a few clicks of the computer and can take responsibility for his losses (and enjoy the gains). In reality trading is more attractive to first time users and and he may be burnt very quickly by a few bad experiences.

2) The Herding Instinct and Contrarian Thinking

Once a person has decided to be an investor, the next big lesson is to learn ‘the Investing Instincts’. And the biggest of them is to resist the Herding instinct.

People collect or herd together in their decisions. They follow the larger group and blindly copy their decisions. But investing in the fundamentals of a company involves understanding the business of a company and taking rational decisions.

  • Perhaps the buy decision was on the basis of 2-3 corporate events / initiatives that are likely to play out over 2-3 years. So the investor needs to watch for these events, and once completed successfully, review the investment, and perhaps exit with his profits.
  • Perhaps the sector, the management and the brand are identified as so good that the company will weather all storms over say, the next 5 years and continue to win and perform financially.

The challenge to such fundamentals based investment decisions are events within these time spans that cause large share price movements. It could be a Modi government win that causes a 30% upside in the overall market and your investment appreciates 50% (a good problem to have). Or it could be a 10% fall in the market that may cause the firm’s share price to fall 20%.

The opposite of the Herding behavior is Contrarian thinking. The Calm investor has to only make 5-6 big Buy or Sell decisions every year.

  • The Modi government win and subsequent 50% upside can be an exit opportunity if a targeted appreciation is achieved. Or it can be ignored if the view is that the upside is higher as the event / initiative is not complete yet, and still to play out. In addition we have an environment of improving market outlook, and still far from bubble territory.
  • The 10% fall can be seen by investors as another opportunity to enter the market at lower levels. For those who are fully invested, this fall can be completely ignored. In the investing world, ‘What goes down has to come back up again’ applies more often than the more popular converse.

Take the current fall in markets. It seems to me that the Sensex move from 20,300 on 7th Feb 2014 to 28,800 on 28th Nov has been a 42% gain over 9 months almost without a break. All big gains are interspersed with small corrections (and the converse). The fall has been anticipated many times over the last 2-3 months. Nobody can predict it accurately. But it is almost a consensus now in the market that there will be a fall.

The investor needs to stay calm and take advantage of it, if and when it happens.

JainMatrix Knowledge Base:

See other useful reports

Do you find this site useful?

  • Visit the Investment Service page to find how you can get more. Or Click LINK
  • Register Now to get our Free reports and much more, on the top right of this page, or by filling this Signup Form CLICK.

Disclaimer

This document has been prepared by JainMatrix Investments Bangalore (JM), and is meant for use by the recipient only as information and is not for circulation. This document is not to be reported or copied or made available to others without prior permission of JM. It should not be considered or taken as an offer to sell or a solicitation to buy or sell any security. The information contained in this report has been obtained from sources that are considered to be reliable. However, JM has not independently verified the accuracy or completeness of the same. Neither JM nor any of its affiliates, its directors or its employees accepts any responsibility of whatsoever nature for the information, statements and opinion given, made available or expressed herein or for any omission therein. Recipients of this report should be aware that past performance is not necessarily a guide to future performance and value of investments can go down as well. The suitability or otherwise of any investments will depend upon the recipient’s particular circumstances and, in case of doubt, advice should be sought from an independent expert/advisor. Either JM or its affiliates or its directors or its employees or its representatives or its clients or their relatives may have position(s), make market, act as principal or engage in transactions of securities of companies referred to in this report and they may have used the research material prior to publication. Any questions should be directed to the director of JainMatrix Investments at punit.jain@jainmatrix.com

Monte Carlo IPO – Visit here for the Short Term

_______________________________________________________________________

  • Price range: Rs 630-645
  • Date Dec 4th 2014 and IPO Period:  03-05 Dec
  • Industry – Textile and Apparel
  • Small Cap with 1370 cr. mkt cap
  • Advice: Buy for the short term

logo

Summary:

Monte Carlo Fashions is a player in woolens, apparel and home furnishings. The financial data available indicates good margins but uneven growth. The IPO valuations look reasonable compared to peers. The brand is strong. Growth plans include a thrust in South and West markets. Negatives and risks include only 3 year financial history available due to recent demerger, significant related party transactions in the supply chain, negative Free Cash flow over the last 3 years and weak Promoter group track record in terms of rewarding shareholders. BUY but with a short term perspective. 

Here is a note on Monte Carlo Fashions Ltd (MCF) IPO.

Monte Carlo Fashions – Description and Profile

  • Monte Carlo Fashions (MCF) is an apparel firm based out of Ludhiana, Punjab.
  • The FY14 revenues were Rs 519 crores and profits 55 cr.
  • It commands under 1% market share in Indian apparel, but has a strong and premium brand, ‘Monte Carlo’ established over 30 years. We can see the product segments in Fig 1a.
Monte Carlo Fashions IPO, JainMatrix Investments

Fig 1 – Product Segments and Shareholding Pattern

  •  Product distribution is through 196 ‘Monte Carlo Exclusive Brand Outlets’ and 1300 Multi Brand Outlets (MBO). Of these 196, 18 are owned and operated by MCF, and the rest run by franchisees.
  • The shareholding pattern post IPO is displayed in Fig 1b.

IPO Offering Outline and Valuations:

  • The offer is of 54.33 lakh shares in price range Rs 630-645 available from Dec 03-05.
  • This 25% dilution will raise Rs 350 cr. at upper end, and value the firm at 1400 cr market cap.
  • The offering is at a PE range of 24.8-25.3 times FY14 earnings. This compares favourably with:
PEs

Fig 2 – PE range of Peers

MCF – Financial snapshot

  • Only 3 years data is available as MCF was demerged from group firm Oswal Woollen Mills Ltd. on 1st April 2011.
  • FY 2013 was a flattish year for MCF, followed by a good year of FY14. See Fig 3.
Monte Carlo IPO, JainMatrix Investments

Fig 3 – Monte Carlo Fashions Financials

  • The leadership team is Jawahar Lal Oswal, CMD and Sandeep Jain, ED.

Cash Flow

  • The Free Cash flow has not been positive for MCF in the last 3 years.
Monte Carlo IPO, JainMatrix Investments

Fig 4 – Free Cash Flow

Why Is Monte Carlo Fashions going for an IPO?

The objects of the IPO are:

  • Partial exit of Samara Capita, a Mauritius based Private Equity firm, that will reduce shareholding from 18.5% to 10.9%
  • Reduction in Promoter holding from 81% to 63.6% that will comply with SEBI rules for Promoter holding below 75%.
  • Visibility and marketing for the Monte Carlo brand and firm.

Industry

  • The Indian Textiles Industry accounts for 4% of GDP, 14% of industrial production; it directly employs 3.5 cr. people (highest after agriculture) and accounts for 17% of all exports.
  • The size of the domestic readymade apparel industry is expected to double within 5 years due to prosperity, better government policy, fashion and brand trends and consumer expectations.
  • Government Policy Support: The Indian government supports the textile industry by investment promoting schemes like TUFS (Technological Upgradation Fund Scheme) and SITP (Scheme for Integrated Textile Parks).
  • MCF too has availed the low interest TUFS loans for its funding needs.

Key Strengths of MCF and IPO offer

  • Strong Monte Carlo brand. MCF was spun off from the older firm, Oswal Woollen Mills. Brand strengths in woolens and warm clothing, and a higher end / premium positioning.
  • Strong presence in North and Eastern parts of India.
  • It rides the key investment theme of “consumption” that is reflected in high valuations for firms from apparel, food and FMCG sectors.
  • MCF has already raised Rs 105 cr. through issue of shares to anchor investors – Aditya Birla Private Equity Trust, DB International (Asia) and Birla Sunlife Trustee Company Pvt Ltd.
  • There is cash on the books of MCF and even the current loans taken are concessional/ low interest govt TUFS loans.
  • It has an asset-light model by outsourcing the apparel production to third-party manufacturers.

Key Weaknesses/ Issues/ Challenges of MCF and IPO offer

  • Weak presence in South and West regions of India. Here MCF plans to widen distribution and push the non-woolen product range like cotton and blended apparel, kids wear and home furnishings.
  • Negative Free Cash flow over the last 3 years. It is investing in its operations.
  • There is only a short financial history of MCF, not enough is known of this company.
  • This business group has not established a track record for rewarding shareholders. Group companies Nahar Spinning and Punjab Woolcoombers (listed in 2007) are today trading below their IPO prices while one, Nahar Capital (listed in 2008), has barely made it to the IPO price level. Another, Nahar International (earlier known as Punjab Concast) is no longer traded on the bourse.
  • High proportion of related party transactions. Complex web of group companies are part of MCF’s supply chain in terms of raw materials, apparel manufacturing, etc. This is seen as a financial uncertainty in terms of related party transactions and potentially notional / temporary profits.

Opinion, Outlook and Recommendation

  • The organisation is rated average in terms of overall offering.
  • The IPO was subscribed 61% of its entire offering till EOD 3rd Dec. This included Institutions 74% and Retail 79%. This is a good sign, and the firm may be able to ride the very positive current investor sentiments and elevated index levels to generate interest.
  • Retail investors may apply for the MCF IPO but should not hold for the long term.

JainMatrix Knowledge Base:

See other useful reports. We have had wonderful success in our IPO/ FPO/ NFO reports.

Do you find this site useful?

  • Visit the SUBSCRIBE page to find how you can get more. Or Click LINK
  • Register Now to get our Free alerts, on the top right of this page, or by filling this Signup Form CLICK.

Disclaimer

This document has been prepared by JainMatrix Investments Bangalore (JM), and is meant for use by the recipient only as information and is not for circulation. This document is not to be reported or copied or made available to others without prior permission of JM. It should not be considered or taken as an offer to sell or a solicitation to buy or sell any security. The information contained in this report has been obtained from sources that are considered to be reliable. However, JM has not independently verified the accuracy or completeness of the same. Neither JM nor any of its affiliates, its directors or its employees accepts any responsibility of whatsoever nature for the information, statements and opinion given, made available or expressed herein or for any omission therein. Recipients of this report should be aware that past performance is not necessarily a guide to future performance and value of investments can go down as well. The suitability or otherwise of any investments will depend upon the recipient’s particular circumstances and, in case of doubt, advice should be sought from an independent expert/advisor. Either JM or its affiliates or its directors or its employees or its representatives or its clients or their relatives may have position(s), make market, act as principal or engage in transactions of securities of companies referred to in this report and they may have used the research material prior to publication. JM and its promoters/ employees have no financial interest in Monte Carlo Fashions and no known material conflict of interest as on date of publication of this report. Any questions should be directed to the director of JainMatrix Investments at punit.jain@jainmatrix.com