Bajaj Finance – a Firm you can Bank on

_________________________________________________________________

  • 23-Jan-2014
  • CMP: Rs 1569
  • Mid Cap – Mkt Cap 7910 crores
  • Advice: Buy with a March 2016 target of Rs 3435

JainMatrix Investments presents investors the complete report on Bajaj Finance as part of the Investor Rewards Fortnight. 

Bajaj Finance is an NBFC on a rapid growth path. It is a leader in auto and consumer durable loans, and a strong contender for a Banking license. Key strengths are diversified business segments, good product range, broad geographical reach, strong ‘Bajaj’ brand and nimble business model. The performance has been steady in 2013, and operational metrics are good, with low NPAs. Gains can accelerate for Bajaj Finance if the Bank license comes through. Invest in this high potential mid cap.

This is a follow-up report to the one published in Jan 2012, entitled – Bajaj Finance, Auto-matic Growth.

Business Profile

  • Bajaj Finance (BFL) is a NBFC promoted by Bajaj Auto 26 years ago. Key management personnel are Rahul Bajaj – Chairman, Sanjiv Bajaj – Non Executive Vice Chairman and Rajeev Jain, CEO.
  • The total Income in FY13 was Rs 3111 crore and PAT 591 cr.  
  • BFL’s products portfolio includes loans for Consumer Durables, Personal use, Against Property & Securities, for Small Business, Construction Equipment, and Insurance Services. See Figs 1 & 2. About 60% of its business is consumer oriented – B2C, while rest is B2B, with a SME focus.
  • About 30% of the 2&3 wheelers of Bajaj Auto are today financed by BFL. In the last 6-7 years, BFL has converted itself into a professional, diversified financing company.
  • BFL has a network of 7,000+ distribution franchise across 112 cities, and 80 lakh plus customers.
  • In 2013, BFL added 1,565 permanent employees, taking the total employee strength to 3,090. This is a sign of business confidence and investments in expected growth.
Business Segments, JainMatrix Investments

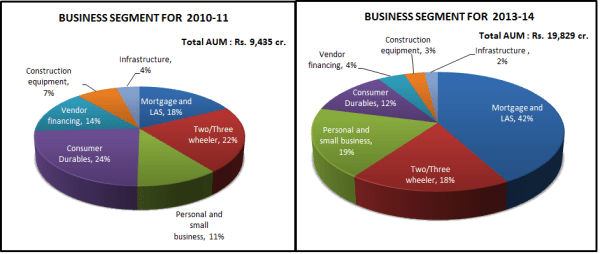
Fig 1 – Business Segments, JainMatrix Investments

  • Funds sourcing – CRISIL has rated it at FAAA/Stable for FDs (high safety on timely payment of interest and principal), A1+ (short-term debt) and AA+/stable (long-term debt) by CRISIL & ICRA.
  • The share-holding pattern is 62.1% Promoters, and public shareholding includes 11.3% individuals, 10.2% FII’s, mutual funds/UTI 7.9%, and bodies corporate 7.3% and 1.2% others.
Fig 2 - Product offerings, JainMatrix Investments

Fig 2 – Product offerings, JainMatrix Investments

Recent News and Updates

  • BFL had a Rights issue in Jan 2013, and raised 750 cr. The issue ratio was 3:19 and pricing Rs 1100.
  • BFL extended its consumer electronics financing business recently to digital product financing.
  • BFL also launched a rural financing initiative in 7 branches and 30 spokes in Maharashtra.
  • The total customers acquired in Q3 FY14 grew by 15%.
  • The firm’s borrowing mix from banks & money market is 60:40. This appears a balanced mix.
  • The Bajaj Group has applied for a Bank license from RBI, which is expected to be issued in early 2014. There are totally 25 applicants. BFL is the firm proposed to be converted to a Bank if this application is successful. There may however be a need for a restructuring within the Bajaj group as after getting banking license there cannot be any preferential treatment to Bajaj Auto.
  • BFL was rated by Aon Hewitt as one of the top employers in India in terms on Employee Satisfaction.
  • Other business achievements – It is the first NBFC to launch online personal loans. It is among the few NBFC with active co-branded credit card (with Standard Chartered Bank. It is the first NBFC to tie up with UIDAI to access Aadhar card/eKYC database.
  • The recent Q3FY14 results were good. AUM grew 33% to 22,461 cr; customers acquired during Q3 rose 15% YoY to 9,62,204 and deployments climbed 45% YoY to 7,532 cr.

Industry Note

  • There are a large number of NBFCs in India (>10,000). These are relatively unregulated companies, unlike Banks that are governed by RBI. In this fragmented market, there is tremendous opportunity to offer Loans and Financial services.
  • RBI has projected a 14% growth in loans for Banks; NBFCs should have higher industry growth rates of 24% for the next five years. (ICRA/ industry experts).
  • Inflation and Interest rates are at highs in Q4 of FY14, which is difficult for the sector. However the 2 year outlook is a slow fall in both, even as the investment cycle recovers in India.

Unique Strengths

  • BFL shares the strong ‘Bajaj’ brand; and is part of the growth of Bajaj Auto through Auto loans. BFL has a wide presence and leadership in high value Consumer Electronics and retail loans.
  • BFL is diversified across customer segments and geographies; this de-risks operations and inspires a confidence in continued growth. BFL has a presence in 7 business sectors (Fig 1) and is nimble enough to shift focus to the performing sectors in order to achieve its targeted growth.
  • The group financial services ambitions and new initiatives are going to be routed through BF.
  • A strong distribution network, spread nationally with presence across customer segments, industries and geographies. The BFL strategy is to diversify their loan exposure with a 30% cap on each segment. This will provide a de-risked business model.
  • With a wide product portfolio, BFL targets cross-selling and up-selling products to its customer base.

Stock Evaluation, Performance and Returns

  • Listed since 1994, BFL performed well over the last 6-8 years, as seen in Fig 3.
  • A sharp fall in price around Jan-Mar ‘13, was caused in part due to the rights issue.
Share Price History, JainMatrix Investments

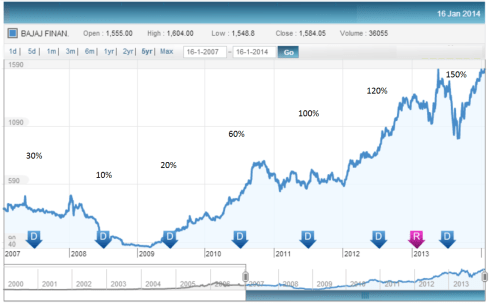
Fig 3 – Share Price History, JainMatrix Investments

The fall we see around August ’13 is linked to the events of 1) threat of stoppage of the Quantitative Easing program in USA, 2) fall in INR v/s USD value. Most Bank share prices in India fell at this time.

Bajaj Finance, Quarterly Growth Growth of Income, Profits, JainMatrix Investments

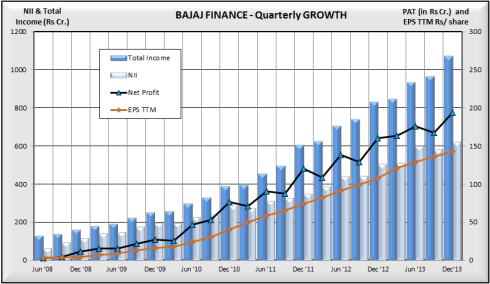
Fig 4 – Bajaj Finance, Quarterly Growth of Income, Profits – JainMatrix Investments

The Growth of Total Income, Net Interest Income, Net Profits and EPS TTM has been very steady since June 2008, see Fig 4.

Price, P/BV ratio, Dividends, JainMatrix Investments

Fig 5 – Price, P/BV ratio, Dividends, JainMatrix Investments

  • The Share price has appreciated by 28% CAGR over the last 9 years. However, post the 2009 fall, the appreciation has been very steep at 86% CAGR over 5 years, mapped in Fig 5.
Price PE chart, JainMatrix Investments

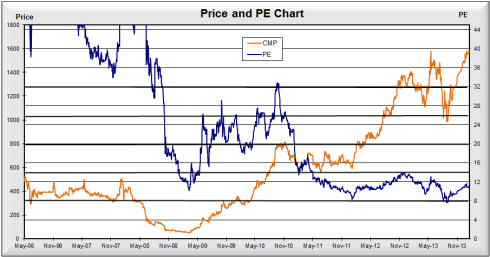
Fig 6 – Price PE chart, JainMatrix Investments

  • Price and PE chart Fig 6, indicates that the PE is distributed over a range of 8-32 times, with the 8 year historical average of 20 times.
  • It shows that PE is currently near all-time lows even though the Price is at all-time highs. It seems the full effect of the Earnings improvements is not yet reflected in the Price.
Price EPS chart, JainMatrix Investments

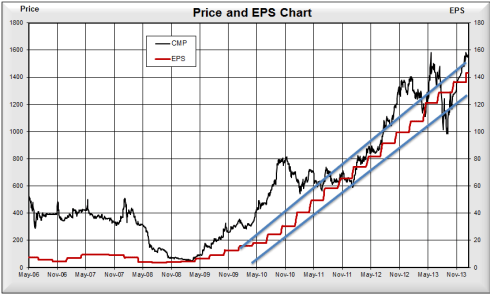
Fig 7 – Price EPS chart, JainMatrix Investments

  • The EPS growth has accelerated since 2010, (Fig 7). This is an excellent chart of the firm’s growth. The EPS appears to be in a channel – of blue lines, and on a good growth path.
  • Dividend yield by the company is 0.95%. Dividend rate has increased steadily over the last 5 years.
  • We can trace the financial metrics of Return on Net Worth, Return on Capital Employed and Tier 1 Capital Adequacy in Fig 8. ROCE is 16% and RONW is 17.6%, in FY13. These are good ratios.
  • Today, BFL has a tier-1 capital adequacy ratio at 17.7% (Sept’13). This is at a comfortable level to fund rapid growth and meet the standards for the sector.
  • NIM has fallen to 11.7% but this is driven by higher share of secured loan products.
  • Gross NPA increased from 1.14% to 1.15% while net NPAs declined from 0.26% to 0.23 % YoY.
Financial Metrics, JainMatrix Investments

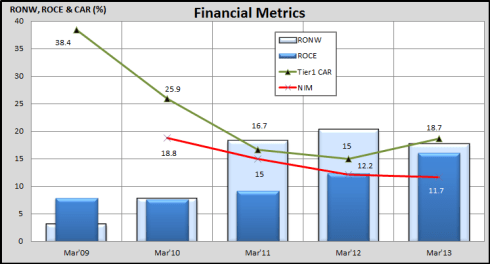
Fig 8 – Financial Metrics, JainMatrix Investments

  • P/BV is 2.35 today which is a fair level, not overpriced.
  • The PEG today is at 0.48 – indicates undervalued status.

Risks:

  • Our base case assumes BFL wins the Banking license, and needs to restructure and invest in itself to re-launch as a bank. The share price will surge post this prestigious win. But in case it does not win this, restructuring costs will be lower and profits higher; but the share price may see some fall.
  • High Inflation. If the current high inflation in India cannot be tamed, it will affect BFL business.
  • Our base case is a mild economic recovery in India. However, if the Indian economy continues to show flat or poor growth, the BFL growth will be hit.
  • Promoter driven consolidation. Bajaj group has other financial firms like Bajaj Allianz (Insurance), Bajaj Financial Solutions (Wealth management and advisory) and Bajaj Finserv. Consolidation will change the outlook and business strategy of BFL.
  • The worse performing business lines have been Infra and commercial lending, which have been pared down over the last two years. No fresh losses should emerge from this loan book.

Peer benchmarking and Financial Estimates

BFL is compared to some of its peers to understand and benchmark its key ratios. See Exhibit 9.

Peer Benchmarking, JainMatrix Investments

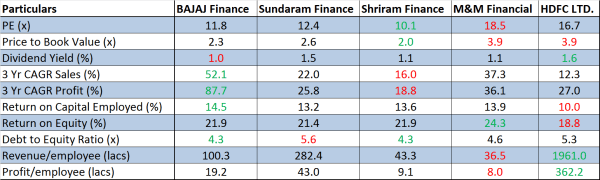
Exhibit 9 – Peer Benchmarking, JainMatrix Investments

  • BFL leads in ratios of growth and Returns.
  • Behind a national major like HDFC, it leads across most parameters.
  • It appears undervalued at Current Market Price.

Three-year projections of BFL financials indicate a robust ramp up of revenues and profits, Exhibit 10.

Financial Projections, JainMatrix Investments

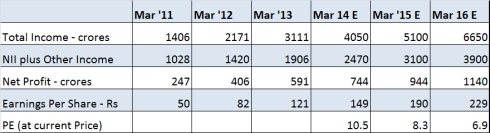
Fig 10 – Financial Projections, JainMatrix Investments

  • Review of Projections from the Jan 2012 report on BFL. While the firm actually exceeded our projections for FY12 and the Profits for FY13 were lower by just 9%, we noticed that the volatility in Banking/ NBFC sector pulled down the valuation & price from our estimates by 35% by end FY13.
  • In the next 2-3 years, this should reverse and the valuation multiples should rise.

Opinion, Outlook and Recommendation

  • Indian market is underserved for loans and financial services. Quick calculations show BFL has 2-3% market share among Indian NBFCs (non-Bank). While small, this indicates a big opportunity for BFL.
  • In India, Consumer debt/ GDP is 9%, low compared to S.Korea 80%, European>50% and China 12%.
  • BFL is a firm gifted with an outstanding, valuable brand, positive image and good reputation. BFL is well placed to capitalize on this by growing into a financial powerhouse with businesses into insurance, loans and finance.
  • In the past few years, BFL has embarked on a business trajectory that, if sustained, can make it a top 5 NBFC in 4-5 years. In essence it may move from mid-cap to large-cap, and shareholders could gain considerably.
  • Invest now and systematically for long-term out-performance.

The projection/ targets for Bajaj Finance are:

  • March 2015 – Rs 2850 – an 81% gain
  • March 2016 – Rs 3435 – an 118% gain

JainMatrix Knowledge Base:

See other useful reports 

Do you find this site useful?

  • Visit the SUBSCRIBE page to find how you can get more. Click LINK
  • Register Now to get our Free reports and much more, on the top right of this page, or by filling this Signup Form CLICK.

Disclaimer:

This document has been prepared by JainMatrix Investments Bangalore (JM), and is meant for use by the recipient only as information and is not for circulation. This document is not to be reported or copied or made available to others without prior permission of JM. It should not be considered or taken as an offer to sell or a solicitation to buy or sell any security. The information contained in this report has been obtained from sources that are considered to be reliable. However, JM has not independently verified the accuracy or completeness of the same. Neither JM nor any of its affiliates, its directors or its employees accepts any responsibility of whatsoever nature for the information, statements and opinion given, made available or expressed herein or for any omission therein. Recipients of this report should be aware that past performance is not necessarily a guide to future performance and value of investments can go down as well. The suitability or otherwise of any investments will depend upon the recipient’s particular circumstances and, in case of doubt, advice should be sought from an independent Financial Expert/Advisor. Either JM or its affiliates or its directors or its employees or its representatives or its clients or their relatives may have position(s), make market, act as principal or engage in transactions of securities of companies referred to in this report and they may have used the research material prior to publication. Any questions should be directed to the director of JainMatrix Investments at punit.jain@jainmatrix.com

Disclosure: It is safe to assume that if the JainMatrix website recommends a stock, the researcher has already invested in it.

Also see: https://jainmatrix.wordpress.com/disclaimer/

Repco Home – A Fortune at the bottom of the Pyramid

_________________________________________________________________

  • 06-Jan-2014
  • CMP: Rs 340
  • Mid Cap – Mkt Cap 2120 crores
  • Advice: Buy
  • Target: 660 by March 2016

Here is a note on Repco Home Finance (RHF). Download the report using the Link – REPCO home finance_JainMatrix Investments_Jan2014

Summary

Repco Home Finance is a Chennai based NBFC. The average loan ticket size is small, and aimed at self-employed and weaker sections of society. Even so, it’s a well-managed firm with Total income, NII and Net Profit growing at 42.6%, 39.7% and 39.6% CAGR over the last 6 years. After the May 2013 IPO the share price has appreciated 98% already. RHF is addressing “the Bottom of the Pyramid” and still doing so with low NPAs and a good NIM. Invest in this firm not just for the growth or profits or share price appreciation, but for the immeasurable social benefits it provides.

Business Profile

  • Repatriates Cooperative Finance and Development Bank, (REPCO BANK) a Govt. of India firm was set up for supporting the rehabilitation of repatriates from neighboring countries mainly Sri Lanka and Burma. Chennai based Repco Home Finance, (RHF) was promoted by REPCO bank in 2000.
  • Total Income in FY13 was 406 cr and Profits 80 cr. Its asset under management are at Rs 4035 crore.
  • RHF focuses on relatively under-penetrated markets, see their business profile in Fig 1.
  • RHF has 82 branches and 20 satellite centers, majorly in South India, with 64% of loan book from TN. The plan is to grow to 100 branches with new branches in Mah, Gujarat, Orissa and West Bengal.  
  • The M.D of Repco Group including RHF is Mr R. Varadarajan, a career Banker.
  • Consumer – The average home loan size is Rs 9.8 lakhs given to lower-income self-employed people. The total construction value may be Rs 15 lakhs, for a 1000 sq. ft house. (JainMatrix estimates).
Fig 1 - Business Overview, JainMatrix Investments

Fig 1 – Business Overview, JainMatrix Investments

  • RHF follows a lean and efficient business model, with small branches having 2-4 employees with local knowledge, a centralized loan process, no DSA sourcing and totally only 398 employees.
  • Good ratings post IPO with ICRA (upgraded) AA- and CARE (assigned) AA- rating for RHF long term loans.
  • Current shareholdings are Promoters 37.4%, FII 6.3%, DII 15.9%, NRIs/Foreign Individuals/Non Resident companies 35.8%, others 4.8%.

Industry Note

  • There are a large number of NBFCs in India (>10,000). This fragmented market offers big growth opportunities for Home Loans. RBI has projected a 14% growth in loans for Banks; NBFCs should have higher industry growth rates of around 24% for the next five years. (ICRA/ industry experts).
  • Housing finance companies account for 40% of the retail home loan market. The home loan portfolios of mortgage NBFCs have also grown faster than commercial banks in the last few years.
  • The top 4-5 companies will have close to 85-90% share of the retail home loans. These firms are HDFC Ltd, LIC Housing Finance, Dewan Housing Finance Corporation and Indiabulls Housing Finance.
  • RHF addresses a market segment that is underserved, and only addressed by a few micro-finance NBFCs. This is a large and unaddressed, high potential sector.
  • Inflation and Interest rates are at highs as of now, which is difficult for the sector. However the 2 year outlook is a slow fall in both, even as the investment cycle recovers in India.

jainmatrix investments, repco home finance

Fig 1 – Business Overview

Unique Strengths

  • Since RHF is promoted by REPCO Bank (a PSU Bank), it should get state govt. support. Repco Bank is part owned by Govt. of India, and TN, AP, Kerala and Karnataka governments.
  • RHF reaches to the underserved, weaker sections of the society, offering small ticket home loans to self-employed persons. It addresses a segment which is underserved and has high growth potential.
  • RHF has a strong local presence in Tamil Nadu, and is extending operations to neighboring states.
  • With a healthy 4% NIM, RHF is profitable while growing fast.
  • With its lean branches and its presence in Tier 2 and 3 cities, and periphery of Tier 1 cities, RHF has an organisation structure well geared to addressing its current customer segment. RHF shares branches with Repco Bank, thus reducing the cost of operations and having synergies.
  • Cost of capital was stable for the last 2 years, and loan rates for customers have not been increased.
  • RHF has conservative lending metrics: LTV (Loan to Value) 65% and IRR 50%. This is a strength.
  • A personal visit by the researcher to a Repco Bank/ RHF branch indicated courteous service and discussions, a competitive home loan rate and simple but efficient branch environment.  

Stock Evaluation, Performance and Returns

  • RHF was listed recently in April 2013, with an IPO pricing of Rs 172. The Rs 270 crore IPO was a success with 1.62 times over-subscription. It has already appreciated 98% since to date.
  • RHF has shown very good performance over the last few years, with Total income, NII (Net Interest Income) and Net Profit growing at 42.6%, 39.7% and 39.6% CAGR over the last 6 years. See Fig 2.
  • A fall in NII% indicates an increase in cost of loans. PAT margins too have fallen from 27% to 20%. However in the backdrop of surging Total Income, this is not worrying.
Fig 2 - Business Financials, JainMatrix Investments

Fig 2 – Business Financials, JainMatrix Investments

  • The loan book grew at 38% CAGR from FY-09 to FY-13.
  • The cost of borrowing of the company is 9.3% which is quite low. The dividend yield is 0.31%.
Fig 3 - Financial Metrics, JainMatrix Investments

Fig 3 – Financial Metrics, JainMatrix Investments

  • From the chart we can see that the NIM ranges between 4-5%. See Fig 3. NIM may have fallen recently, but it is high at 4% levels. It may rise again post IPO.
  • Gross and Net NPA are within comfort levels at 1.48% and 0.99%.
  • Post IPO the capital adequacy ratio (CAR) is at very good level of 25.6% which is well above 12% level specified for the sector. RHF has room for loans growth for several years with current capital.
Fig 4 - Price and PE Chart, JainMatrix Investments

Fig 4 – Price and PE Chart, JainMatrix Investments

  • Price and PE chart shows that Share Price and PE are fairly in sync. We can see that PE has risen rapidly post IPO from 12 to 22 times and the mean level stands at 17 times. See Fig 4.
  • ROCE is 11.6% and Return on net worth is 12.6%, these are good ratios.
  • Its asset under management stood at Rs 4035 crore by H1 FY14, a growth of 30% in 1 year.
  • PEG is at 0.7 – indicates undervalued status, below the norm of 1.

Peer Benchmarking and Financial Projections

In a benchmarking exercise, we compare RHF with its peers.

Benchmarking

  • It appears that RHF is overpriced and closer to HDFC Ltd on valuations. However we can see that RHF has good NIMs and lower D/E ratios.
  • Also on productivity metrics, RHF scores high. This indicates that in the short term, growth can be accelerated by means of hiring.
  • RHF by virtue of its small size, growth and lack of competition looks well placed.
  • Bajaj Finance also shows good metrics. See a research report on the same. LINK

Find projections of RHF financials in Exhibit 6.

Projections

Opinion, Outlook and Recommendation

  • Indian market is underserved for loans and financial services. This is more so in the poorer sections and self-employed of society. RHF has little competition in this segment.
  • Indications are that RHF will continue to grow its business well. The exit of some Private equity investors post IPO should actually accelerate the profits due to lower costs.
  • RHF is not just doing a Social Service, but doing so at a healthy profit. In his famous book, “The Fortune at the bottom of the Pyramid” the respected author C K Prahalad turned attention to firms that can do this. We feel RHF is one such company.
  • RHF has had its IPO only 9 months ago. As the company becomes better known and understood, we feel investors will understand the Social achievements of RHF.
  • Invest in RHF not just for the growth or profits or share price appreciation, but for the immeasurable social benefits it provides. Invest systematically for long-term out-performance.
  • Advice: Buy with a Target of Rs 660 by March 2016
SUBSCRIBE NOW. Click on See Offering

JainMatrix Knowledge Base:

See other useful reports

Disclosure: It is safe to assume that if the JainMatrix website recommends a stock, the researcher has already invested in it.

Do you find this site useful?

  • Visit the SUBSCRIBE page to find how you can get more. Click LINK
  • Register Now to get our Free reports and much more, on the top right of this page, or by filling this Signup Form CLICK.

Disclaimer:

These reports and documents have been prepared by JainMatrix Investments Ltd. They are not to be copied, reused or made available to others without prior permission of JainMatrix Investments. Any questions should be directed to the director of JainMatrix Investments at punit.jain@jainmatrix.com

Also see: https://jainmatrix.wordpress.com/disclaimer/

Balkrishna Industries – The Tyres Roll Faster

  • 06 Sept 2013
  • CMP: Rs 238
  • Small Cap – Mkt Cap 2,300 crores.
  • Advice: Buy (Target projections are for Subscribers Only).

Summary

  • BKT is a fast growing tyre exporter with Revenues, EBITDA and PAT up 25%, 28% and 44% CAGR in 6 years.
  • It is poised to double capacity by FY15. The tyres sell to a very large global market, are a high quality products. BKT can maintain its margins, and will gain from the INR weakness.
  • Today with the PE of 6.6 times, it is available at the lowest valuations in the last 6 years.
  • BKT is a Buy.
  • Risks to this investment are: Global conflicts and economic uncertainties, Natural rubber price rise and a Promoter group restructuring.
English: A picture of our John Deere 9420 trac...

English: A picture of our John Deere 9420 tractor and chisel plow taken in August 2006. (Photo credit: Wikipedia)

Business Snapshot:

  • Balkrishna Industries (BKT) is a Mumbai based firm that makes off-highway tyres (OHT) for agriculture, mining and earth moving vehicles. It derives 90% of revenues from exports. See tractor above.
  • The consolidated Revenues are 3,394 cr with Profits 350 cr (FY13).
  • These tyres are manufactured at five mfg units: Bhiwadi & Chaupanki in Raj., Aurangabad, Mah., and Dombivili, Mumbai. The new greenfield unit at Bhuj, Guj. is partially operational.
  • BKT currently has a capacity of 1,44,000 tonnes a year. The company is on an expansion program for both de-bottlenecking the existing facilities, as well as a Rs 1,800-crore greenfield factory at Bhuj, which will expand the company’s capacity to 2,70,000 tonnes by FY15.
Fig 1 – Business Segments at BKT, in % (JainMatrix Investments)

Fig 1 – Business Segments at BKT, in % (JainMatrix Investments) Click to expand

  • Tyres are exported from Mundra Port through 200 distributors to 120 countries, see Fig 1. It supplies to companies such as Volvo, John Deere, Ferrari and JCB across the world.
  • BKT also imports some raw materials (Rubber), but is a net exporter.
  • It has about 4% market share globally in the OHT business.
  • The Promoter/ CMD is Arvind Poddar, who has been at the helm of BKT since 2006.
  • BKT’s OHT tyres  are used for Agricultural, Industrial, Material Handling, Construction, Earthmoving (OTR), Forestry & Garden Equipment and All-Terrain Vehicles (ATV).
  • Current shareholding is of Promoters 58.3%, MF/ DII/ FII 30.3%, Individuals 8% and Others 3.4%.

Pricing Snapshot

(Content for Subscribers Only)

Fig 2 Price History

The available 6-year view of the share price of BKT in Fig 3 shows us:

  • BKT share has been somewhat volatile. Today it is at 25% below the Jan 2013 high of 317.
  • Investors have been rewarded with steady dividends and a stock split in 2010 (FV10 to FV2).
  • At CMP, it has given shareholders 15% annual appreciation so far.
Fig 3 – Consolidated Financials Snapshot, JainMatrix Investments, click to expand

Fig 3 – Consolidated Financials Snapshot, JainMatrix Investments, click to expand

Financial Snapshot

  • Growth has been steady with Revenues, EBITDA and PAT up by 25%, 28% and 44% CAGR in 6 years.
  • In FY11, there was a compression in margins due to an increase in international Rubber prices. Even though this was handled well by the firm, and profits increased, the P/E (ttm) has rapidly fallen from 30.8 times (FY09) to 6.6 times currently, see Fig 3.
  • The firm is in an investment phase for the Bhuj plant, but the D/E is at a fair 1.49 times. The capital investments are from a combination of debt and internal cash flows.
  • Return on Capital Employed is 15.63% while Return on Net Worth is 24.24%.
  • Equity Share Capital has remained unchanged for 7 years at 19.33 cr., indicating corporate stability.
  • Dividend yield is a low 0.6%.
  • PEG based on 1 year projection is at 0.22 – indicates a very undervalued stock.

Cash Flow

(Content for Subscribers Only)

Fig 4 – Free Cash Flow 

Financial Projections

(Content for Subscribers Only)

The financials for BKT are projected till FY15.
Fig 5 – Two year Financial Projections

Strengths and Opportunities

  • BKT is in a business segment that requires the production of a large range but low volumes of tyres. This makes BKT somewhat insulated from the competition, which focuses on high volumes.
  • BKT focuses on the tyre replacement market (80% of sales) rather than on direct sale to manufacturers. This is a steadier market than OEM. The margins here are also higher.
  • BKT hedges its forex receivables, to reduce fluctuations. Thus the recent rupee depreciation against the USD by 20% may not immediately benefit it, but this benefit should kick in over the next 1 year.
  • The Bhuj factory is already partially commissioned, so it is already boosting production. The Bhuj location will help BKT reduce on logistics costs with its proximity to Mundra Port for raw materials imports & processing, and exports.
  • With market-share at a low 4% of global OHT segment, there exists large room to grow volumes.
  • BKT develops over 150-160 new tyre sizes every year, with a very fast turnaround time of 8-10 weeks for new product development. This agility is a powerful competitive edge.
  • In FY13 it had net forex earnings of >1000 cr. in USD & Euros. BKT will gain from rupee depreciation.
  • BKT has a low cost structure, compared to global competition/ peers.
  • Radialisation is gaining momentum in the OHT industry, and BKT has allocated a large proportion of the new capacity at Bhuj plant for Radials, to ride this trend.

Risks and Concerns

(Content for Subscribers Only)

Opinion, Outlook and Recommendation

  • BKT has been a steady performer in the last few years in terms of Revenues, Margins and Profits.
  • It is poised to double capacity by FY15. It is catering to a very large global market, and is seen as a high quality product, and can maintain its margins. These markets are poised for economic recovery (Europe, USA).
  • In addition it will gain from the INR weakness.
  • Today the BKT valuations are very low. With the PE of 6.6 times, it is available at the lowest valuations in the last 6 years.
  • BKT is a Buy. (The target is for Subscribers Only).

JainMatrix Knowledge Base:

See other useful reports

  • Adani Port – August 2013 – LINK 
  • BHEL – a Power Value Play – LINK
  • NHPC – Steady, Cheap, Defensive Power Generator – LINK 
  • Cairn India – A Formula for Success – LINK
  • Mindtree – A Possible Star – LINK

Disclosure: It is safe to assume that if the JainMatrix website recommends a stock, the researchers have already invested in it.

Do you find this site useful?

  • Visit the SUBSCRIBE page to find how you can get more. Click LINK
  • Register Now to get our Free reports and much more, on the top right of this page, or by filling this Signup Form CLICK.

Disclaimer

These reports and documents have been prepared by JainMatrix Investments Ltd. They are not to be copied, reused or made available to others without prior permission of JainMatrix Investments. Any questions should be directed to the director of JainMatrix Investments at punit.jain@jainmatrix.com

Also see: https://jainmatrix.wordpress.com/disclaimer/

Adani Port and SEZ – An Indian Port Dominator

——————————————————————————————————————————————–

  • 23rd Aug 2013
  • CMP: Rs 123
  • Large Cap – Market Cap 25,500 crores
  • Advice:  Medium Risk, High Gain stock. BUY with a 2 yr perspective

JainMatrix Investments presents investors the complete report on Adani Port and SEZ as part of the Investor Rewards Fortnight. 

Key Reasons to Invest:

  • AP’s Mundra Port and Indian operations are excellent infra assets with Revenues, EBITDA and Profits up by 36%, 32% and 50% CAGR over the last 5 years.
  • AP can emerge as a port sector dominator in 3-4 years. The currently govt. dominated Indian Port sector is constrained on capacity and efficiency, offering a large opportunity. 
  • Divestment of the Abbot Point Port, Australia has de-risked the business.
  • It has only medium debt, and the cash flow is likely to improve in coming quarters. 
  • Risk: Environmental review and SEZ clearances by Govt. of India. 

This is an update of my Sept 2012 report ‘Adani Port – The Great Australian Adventure’ available here.

Adani Port – Description and Profile

  • Adani Port and SEZ – (AP) is Gujarat based firm with FY13 revenues 3841 cr and PAT 1639 cr (consolidated).
  • The Founder/Chairman of AP is Gautam Adani, a self-made entrepreneur.
  • AP businesses include Mundra Port, the largest private port – 82mmt in FY13, an adjacent SEZ area of 6,500-hectare and several terminal operating contracts at other Ports in India. (mmt is million metric tonnes Cargo)
  • Mundra Port was #2 among Indian ports in FY13, with a 15% market share, and has become #1 this year. It trades in a diverse cargo base like bulk, liquid, project cargo and container, implying lower business risks.

Mundra Port

  • It’s a private port, so Mundra is free to price its services, unlike the PSU ports in India. It has ‘take or pay’ arrangements with many of the customers. This protects AP from sudden drops in demand.
  • AP is also developing and operating terminals at Hazira, Mormugao, Dahej, Hazira, Kandla and Vizag in India. AP as an operator now has a presence in seven ports in India.
  • Connectivity and logistical facilities connect the Port, berthing and storage facilities to Roads, Rail, Airstrip and Pipelines for goods transportation. Growth in Cargo was 29% in FY13. See Exhibit 1.
Consolidated Cargo, JainMatrix Investments

Exhibit 1 – Port Operations Growth, JainMatrix Investments

  • The Shareholding in % is Promoters 75.0, MFs/DII 5.1, FIIs 15.0, Individuals retail/HNI 3.1 and Others 1.8.
  • Adani Enterprises is the holding company with cross-holdings in Adani Power and AP. The group is focused on sectors of Coal, Mining, Port Logistics and Power generation, and the three firms execute on this plan.
  • The vision for AP is to increase annual cargo handling capacity from 91 mmt in 2013 to 200 mmt by 2020.

Events, News and Strategies

  • In Q1FY14 Mundra Port overtook Kandla to emerge as India’s largest port by handling 24 mmt (Kandla 23).
  • The Abbott Point Port, Australia was acquired by AP in June 2011. But in Mar 2013, it was divested to its promoters, freeing AP of a complex foreign asset and large debt, so it can concentrate on Indian operations. Post a valuation exercise, the entire debt and equity used for this purchase was bought out.
  • In early May, the Union government granted security clearance to AP, thereby allowing the firm to participate in port/ terminal bids, removing a restriction that was placed on it in November 2010.
  • Tata’s Mundra UMPP and Adani Power obtained approval from the CERC for a revision of power tariff due to rising imported coal costs. This coal is routed through Mundra Port.
  • Adani Group is exploring a listing of holding company Adani Enterprise on an overseas bourse, to raise cash and help reduce debt at a group level. If this succeeds, it will trigger a price appreciation.
  • The promoters of AP recently reduced stake to SEBI specified 75%, raising 1,000 cr via Institutional placement.
  • New Projects: Possible investments include the Dharma Port, a new port on the East coast. This high potential port has the deepest draft and cargo capacity of 25mmt in place, with a long term expansion plan to 100mmt.
  • Tie ups with Maersk and Mediterranean Shipping Co. (MSC), the world’s top container shipping lines should help increase cargo volumes in Mundra. Ports assets at  Hazira and Dahej will see full utilisation from FY14.

Industry Note:

  • 95% of India’s international trade is done through the Sea Ports. Traffic projections for next 8 years are 11% growth CAGR (Shipping Ministry). As Imports and Exports grow rapidly, the constraint will be Port capacities.
  • Mundra Port is able to provide port access to industries in Gujarat, Maharashtra and North Indian regions. It has an excellent location and the connectivity has been well developed.
  • The Central govt. Ports are constrained in terms of low tariffs; and terminal operators are not incentivized to grow volumes, resulting in stagnant capacities and falling market share. Most of the major ports are operating near the full capacity, resulting in high per-berthing detention and turnaround time of vessels.
  • Ports capacity needs to be increased for better service and operations. This is a big opportunity for AP.

Stock Valuation, Performance and Returns 

Share Price and Dividend, JainMatrix Investments

Fig 2 – Share Price and Dividend, JainMatrix Investments

  • The IPO of AP in Nov 2007 was successful. It was oversubscribed 115 times, and provided listing gains. However it was aggressively priced, at 88 (Rs, adjusted). See Fig 2.
  • There was a split in Sept 2010, from FV10 to FV2.
  • IPO investors have seen a 6% CAGR returns since listing. The Dividend has increased steadily, till the current 50%, i.e. Re 1 on FV Rs 2. This gives a dividend yield of 0.8%.
  • Volatile Prices – Share price rose post IPO to 264, fell to 50 in Nov’08, rose again to a high of 185 in Oct’10, before dropping to today’s 131.
Adani Port Quarterly Sales and Profits, JainMatrix Investments

Fig 3 – Adani Port Quarterly Sales and Profits, JainMatrix Investments

  • The 5 year growth has been rapid, with Revenues, EBITDA and Profits up 36%, 32% and 50% CAGR, Fig 3.
  • With higher volumes, the margins have reduced, so Operating Margins are 64% and PAT Margins are 28%.
Cash Flow and Financial Ratios, JainMatrix Investments

Fig 4 – Cash Flow and Financial Ratios, JainMatrix Investments

  • Debt-equity is 1.67, down from recent highs. This is fair for an infra company, Fig 4.
  • All infra companies incur high initial investments to create the assets. This is true of AP, which has a medium Cash flow due to recent investments in new terminals and capacity expansions.
  • EPS (adjusted) is up 45% CAGR in recent years.
  • Fig 5 tracks the market price of AP against its P/E, ttm. The PE for AP has been in a range of 15-45 times over 5 years. But current PE of 14.3 is at low end of this range.
Adani Price and PE Chart, JainMatrix Investments

Fig 5 – Adani Price and PE Chart, JainMatrix Investments

Adani Price and EPS Chart, JainMatrix Investments

Fig 6 – Adani Price and EPS Chart, JainMatrix Investments

  • The chart (Fig 6) plots the market price against the adjusted EPS over the period.  EPS shows us a steady quarterly increase indicating stable business performance.
  • Return Ratios are improving – ROCE is 13% (7.8% in FY12) while RONW is 25% (23% in FY12).
  • Our calculation of the PEG is 0.47 (0.55 in FY12), which indicates an undervalued stock.

Benchmarking and Financial Projections

We have benchmarked AP with comparable leaders from other sectors, Exhibit 7:

Benchmarking, JainMatrix Investments

Exhibit 7 – Peer Benchmarking, JainMatrix Investments

It appears that AP valuations look rich; the Sales & Profits are steady; Low asset turnover; Return ratios are good, while debt is high, and Interest coverage is low. The explanation is that:

  • AP has always been perceived as a pioneer/ leader, so it has had higher valuations.
  • AP has large assets that can be exploited, so the SEZ land bank is a key asset that can be monetized.
  • Acquisition of assets like Dharma Port may involve large investments but over time the Returns will improve.

Financial Projections:

Here are the 2 year financial projections for AP, Exhibit 8.

Financial Projections, JainMatrix Investments

Exhibit 8 – Financial Projections, JainMatrix Investments

Note – The financial projections in my Sept 2012 report were actually exceeded by AP in FY2013 by Turnover – 28%, EBITDA – 53% and Profits – 13%, partially due to the divesting of the Abbot Point asset, and rest due to overall excellent performance !! However, the share price is still not reflecting this.

Risks

  • A panel set up by the Ministry of Environment and Forests (MoEF) to evaluate the firm against a PIL and complaints reports that AP flouted green norms. The possible result of this is a penalty/ fine that will be used to take corrective steps in the Mundra Port region.
    • Certainly AP will have to modify its policies and ensure compliance in future.
  • One of the criticisms of AP has been that this group is very aggressive, and in its push for growth and volumes ignores aspects like environment and safety systems and procedures.
  • Gujarat High court in a May 2012 court order has stayed development work at AP due to unauthorized construction over a 1,840-hectare enclave that was not vacant, and had no Central environmental clearance – this may delay additional construction for the SEZ area.
    • AP has reapplied for the SEZ status for this parcel of land.
  • Outside the AP business, the Adani Group includes Adani Enterprises and Adani Power. As of now these two group entities have a troubled business outlook in terms of high debts, mining sector clampdowns, high costs of coal imports and poor financials. This may affect AP prospects directly or indirectly.
  • In absolute numbers, AP consolidated debt is 10,600 cr (Mar 2013), of which 7,500 cr is in foreign exchange.
    • As per reports, the forex debt is naturally hedged by marine/ container income, for interest & repayment.

Opinion, Outlook and Recommendation

  • Seaports are very critical infrastructure for India. While imports have grown tremendously recently, we expect exports to also pick up and accelerate in the coming years. Almost 95% of merchandise Ex-Im is transported by seaports. The 5-9% GDP growth range in India is now testing the capacities of Indian Ports.
  • Govt. ports so far have been constrained in terms of capacity, speed of execution and pricing.
  • AP’s Mundra Port and other Indian operations are excellent. AP will capture market share due to investments in capacity, good connectivity, excellent facilities, speedier turnarounds and proximity to demand centers.
  • AP is quickly emerging as a street smart and very aggressive competitor in the Port terminal construction and operation space, across cargo categories. With AP bidding for and setting up terminals even in PSU ports, AP in the next 3-4 years may be able dominate the sector. With large market share will come pricing power and better margins.
  • With the exit from the Abbot Point Port, the EPS growth may continue in the high 40% for the next 3 years.
  • The price has fallen 30% from the 175 peak in May 2013. PE has fallen to new lows. This provides a good entry point for long term investors.
  • Investors may consider AP as a Medium Risk, High Gain stock. Our call is BUY with a 2 yr perspective.

To read such valuable reports, immediately on publishing, and to get a full year of such reports you need to subscribe to JainMatrix Investments, on this link,  Subscribe.

JainMatrix Knowledge Base:

Additional Infrastructure sector reports from JainMatrix Investments:

  • BHEL – a Power Value Play – LINK
  • NHPC – Steady, Cheap, Defensive Power Generator – LINK 
  • Cairn India – A Formula for Success – LINK
  • Mindtree – A Possible Star – LINK

Check back on the website www.jainmatrix.com for updates.

Disclaimer and Disclosure:

It is safe to assume that if the JainMatrix website recommends a stock, the researcher has already invested in it. Punit Jain has owned (long only) Adani Port and SEZ since Jan 2010.

This document has been prepared by JainMatrix Investments Bangalore (JM), and is meant for use by the recipient only as information and is not for circulation. This document is not to be reported or copied or made available to others without prior permission of JM. It should not be considered or taken as an offer to sell or a solicitation to buy or sell any security. The information contained in this report has been obtained from sources that are considered to be reliable. However, JM has not independently verified the accuracy or completeness of the same. Neither JM nor any of its affiliates, its directors or its employees accepts any responsibility of whatsoever nature for the information, statements and opinion given, made available or expressed herein or for any omission therein. Recipients of this report should be aware that past performance is not necessarily a guide to future performance and value of investments can go down as well. The suitability or otherwise of any investments will depend upon the recipient’s particular circumstances and, in case of doubt, advice should be sought from an independent Financial Expert/Advisor. Either JM or its affiliates or its directors or its employees or its representatives or its clients or their relatives may have position(s), make market, act as principal or engage in transactions of securities of companies referred to in this report and they may have used the research material prior to publication. Any questions should be directed to the director of JainMatrix Investments at punit.jain@jainmatrix.com

Mindtree Ltd. – A Possible Star

_____________________________________________________________

  • 12 June 2013
  • CMP: Rs 800
  • Mid Cap – Mkt Cap 3550 crores.
  • Advice:  Buy

Executive Summary

Mindtree Ltd is a mid-sized IT services company based out of Bangalore. It has good management, experienced professionals drawn from the industry. The growth of the firm has been steady. Revenues, EBITDA and PAT have gained by 26%, 27% and 25% CAGR over the last 6 years. Mindtree has reached a certain critical size in terms of revenue and employees, from which growth can accelerate and it can be a large cap in 4-6 years. We expect these plans to play out and make it a very rewarding investment. 

(Find below a limited public report. Subscribers have access to the full report including Risks, Price – PE and EPS charts, Financial Projections, Benchmarking and 2 year Price Targets)

Mindtree Ltd. (MT) is a new age Mid Cap software services firm based in Bangalore.

Business Snapshot:

  • The consolidated turnover is Rs 2,362 crores and Profits 339 cr (FY13).
  • The Chairman is Subroto Bagchi and MD-CEO is Krishnakumar Natarajan; they co-founded the firm in 1999. Today it has about 11,600 employees, spread over Bangalore, Chennai, Hyderabad and Pune.
  • MT has a focus on 4 business verticals; USA is the largest revenue market, see Fig 1 A and B.
  • A recent achievement was the UID/Aadhaar project where MT developed the core application.
Fig 1 – Mindtree by Segments (A) and Geographies (B) for FY2013 (JainMatrix Investments)

Fig 1 – Mindtree by Segments (A) and Geographies (B) – JainMatrix Investments

Pricing Snapshot

The view of the share price of MT in 6 years since the 2007 IPO shows us:

  • From the IPO at Rs 425, the share price has risen by an annual average of 11.5% in 6 years.
  • The share has been volatile, as post IPO the peak was 1021, and the bottom 187 in 2009.
  • The Dividend has risen to the current 120%, see Fig 2, indicating a dividend yield of 1.5%.
Fig 2 – Price and Dividend History (JainMatrix Investments)

Fig 2 – Price and Dividend History (JainMatrix Investments)

Financial Snapshot

  • The Revenues, EBITDA and PAT have gained by 26%, 27% and 25% CAGR over 6 years.
  • MT is virtually debt free and has Cash on its books of 603 cr. or Rs 145/ share.
  • The average PE over the last 6 years is at 20 times. The P/E has moved in a range of 9-35 times, and is currently at 10 times.
  • In the last 3 years, the P/E of MT has been in the 8-14 times range, even as the share price has increased 2.5 times, in line with EPS growth.
Fig 3 – Financials Snapshot (JainMatrix Investments)

Fig 3 – Financials Snapshot (JainMatrix Investments)

 Opportunities and Strategies

  • The worldwide end-user spending in IT Services was US$ 845 billion in 2011, while Indian turnover was $88b, indicating a 10.4% global market share. (Source: Gartner, NASSCOM). Thus there is ample opportunity to grow.
  • Also big opportunities lie in adjacent /related markets like Software Products and bundled Hardware-Software solutions.
  • The industry contributed to 7.1% of the Indian GDP.
  • India has a competitive advantage in IT services due to availability of skilled manpower, good telecom/ internet infrastructure, English language skills and a lower cost structure.
  • With the industry having taken off in India in the 90s, the Indian firms now have sufficient scale, maturity and focus to be in contention to win IT services business in many global markets.
  • The recent USD strengthening (to around Rs 58) has improved the outlook for all IT exporters.
  • The IT Services industry has for long been linear in its growth, with addition of human resources contributing much of the business growth. But new business models are Non-linear, like SaaS, Outcome based contracts, platform based solutions, creation of IP, Products, etc.
  • MT’s identified business verticals of Product Engineering Services, Auto & Retail, BFSI and Travel, Media & Services are large sectors with good potential. Newer IT business trends like Mobility, Cloud and Open Source also seem to be well mapped. (Some important trends that we’d like to see MT into are Social Media and Big Data and Analytics).
  • MT is quite clear that growth will be organic and not through M&A. This is beneficial for investors.
  • With employee base > 10,000 and IT services turnover > 2000 crores, MT can be seen as a firm that has crossed a certain critical mass and now can bid for much larger new assignments.
  • MT is reducing its long tail of ‘small clients’ and focusing on mining its Fortune 500 clients to add service lines and grow business rapidly.

Opinion, Outlook and Recommendation

  • Over the next 2-3 years, exports growth is going to become very important in the Indian economy. The Software sector which is the leading exporter (25% of Indian exports in FY13) will receive a number of sops and benefits. In addition the USD strengthening will also boost sector performance.
  • MT is at a critical phase of growth, where it should be able to accelerate revenues and profits from this point, having achieved a certain critical mass.
  • MT has cash on its books of Rs 145 per share. In other words, a share of Rs 800 actually costs you only Rs 655. This is not an empty hope or wish. The savvy management has increased the Dividend this year from 40% to 120% to distribute this cash. Further shareholder enriching events can be expected in the medium term such as increase in dividends, bonus shares, share buyback, etc.
  • MT has gone through a cycle of very high expectations (and valuations) at the time of IPO, to a current state of low expectations. However it retains its essence of a savvy experienced management, global presence, absorption of new technologies and willingness to take small risks.
  • MT is a Buy at current levels.

JainMatrix Knowledge Base

See other useful reports

  • Tribhovandas Bhimji Zaveri – LINK 
  • JainMatrix Mid Cap Model Portfolio 2013 – LINK
  • Apple Inc. – LINK
  • Arshiya International: A Collapsing Star – LINK
  • Bharti Airtel – This is a year of consolidation – LINK
  • Yes Bank – LINK

Do you find this site useful?

  • Visit the SUBSCRIBE page to find how you can get more. Click LINK
  • Register Now to get our Free reports and much more, on the top right of this page, or by filling this Signup Form CLICK.

Disclaimer:

These reports and documents have been prepared by JainMatrix Investments Ltd. They are not to be copied, reused or made available to others without prior permission of JainMatrix Investments. Any questions should be directed to the director of JainMatrix Investments at punit.jain@jainmatrix.com

Also see: https://jainmatrix.wordpress.com/disclaimer/

Tribhovandas Bhimji Zaveri

  • Date: May 5th, 2013
  • Mid Cap –Mkt Cap 1452 crores 
  • CMP: Rs 219

Tribhovandas Bhimji Zaveri is a strong niche brand that is spreading out with a national rollout. It has a focus on luxury, high quality jewellery, and excellent design. Revenues, EBITDA and Profits have grown by 35%, 44% and 50% respectively CAGR over the last 5 years.

It had a fairly succesful IPO in 2012. And has appreciated 79% since.

Is this sustainable? Can it withstand the intense competition within the sector?

Read the report where JainMatrix Investments analyses this firm. To read this valuable report, you need to subscribe to JainMatrix Investments. On this link, check the details and Subscribe to this website to receive such valuable reports directly delivered to your Inbox.

Do you find this site useful?

  • Visit the SUBSCRIBE page to find how you can get more. Click LINK
  • Register Now to get our Free reports and much more, on the top right of this page, or by filling this Signup Form CLICK.

Disclaimer

These reports and documents are prepared by JainMatrix Investments Ltd. They are not to be copied, reused or made available to others without prior permission of JainMatrix Investments. Any questions should be directed to the director of JainMatrix Investments at punit.jain@jainmatrix.com Also see: https://jainmatrix.wordpress.com/disclaimer/

KEC International – A Power Utilization Play

—————————————————————————————————————————

June 2014 Promotion – this share has appreciated 112% to today’s CMP 117.

This is the 2013 update of the report called KEC International is a Modern Powerhouse, published in Feb 2012. Available on LINK.

  • Date: March 11, 2013
  • CMP: Rs 55.0
  • Small Cap: Market Cap 1394 crores
  • Advice:  Firm is valued at Rs 82; available today at 49% discount
  • Target:   March 2014 target of 179.  Medium Risk.

KEC International is a Power transmission EPC firm with operations in 48 countries. The synergistic diversifications into Power Systems, Telecom, Water and Railways are stabilizing. The Order Book has grown by 10.3% in a challenging FY13 year. The KEC share is available at a 49% discount to valuations. Invest for long term in this ‘Power Utilization Play’.  

High_voltage_transmission_towers_and_lines

High Voltage Transmission Towers and Lines

KEC International – Description and Profile

  • KEC International (KEC) is a global Engineering Procurement and Construction (EPC) firm with a focus on Power Transmission. It is the largest transmission tower manufacturing company in the world.
  • It is the 5,900 crores (FY12) flagship company of the RP Goenka group. Current Market Cap is 1238 cr. Employees number over 4800; Order Book is Rs.10,150 cr, giving about 1.5 years of visibility.
  • From a core of Power transmission, it has diversified into EPC related areas like Power Systems, Cables, Railways, Telecom and Water. Fig 1. About 90% of KEC customers are Government firms.

KEC Business Portfolio, JainMatrix Investments

Fig 1 – KEC is diversifying its business portfolio 

  • Beyond India, it has operations in 48 countries. The 2010 takeover of SAE Towers, a US based lattice transmission towers manufacturer has given it a good North & Latin America footprint.
  • Manufacturing plants are in India – Nagpur, Jabalpur and Jaipur; in Americas at Monterrey (Mexico) and Belo Horizonte (Brazil). Total tower manufacturing capacity is 274,000 MTs.
  • Shareholding pattern is Promoter 44.5%, MFs/DII 36.5%, FIIs 2.2%, Individuals 11.1% and Others 5.7%. The wide ownership with Indian Institutions is good and medium Promoter ownership is fair.

Business Model and Strategy

  • The core capability of KEC is its ability to deliver power transmission lines to Utilities, including design, materials procurement, execution and Project Management.
  • KEC also provides EPC services to Telecom, Railways and Water, see Fig 1. KEC has expanded into Power related areas – Cables, manufacture and cabling solution and – Power Systems, designing and constructing substations and Electrical Balance of Plant (E- BOP) delivery services.
  • KEC is successfully diversifying its business, thus de-risking the overall business portfolio. See Fig 2.
Order Book Breakup_Feb2013, JainMatrix Investments

Fig 2 – Order Book Breakup, Feb 2013, JainMatrix Investments

Industry Note:

  • Power Industry is broadly classified into Generation, Transmission and Distribution. The Indian power sector faces huge demand growth. But the government’s power generation capacity Plan v Achievement was 68% in the 11th Plan. (We are in 12th Plan now). Peak power shortfall has been 8-12% in 10 years. 40% of people have no access to electricity, and others access poor quality power.
  • The Public sector dominates the industry, owning 70-80% of current assets. However with the opening up to the Private sector, upto 50% of new investments are expected to be Private sector.
  • The key Power sector constraints are Fuel Linkages, State Elec. Board financial conditions and T&D losses. Most of the SEBs did not raise tariffs due to political and state govt pressures. This is being corrected now by the Central Govt. Power Generation has grabbed a lot of interest, but with Fuel Linkages still an issue, and restructuring of SEBs a slow process, the focus will now shifting to T&D.
  • T&D losses are 32% of generating capacity compared to the global average of 10%. The T&D projects help with better grid connectivity, reduction in losses and upgradation of Transmission equipment. T&D losses are due to power theft, poorly T&D equipment, low T&D capacity and bad metering. Thus KEC International is a Power Utilization Play, a critical need of the day in India.
  • The Transmission industry bidding norms have changed recently to ‘Tarriff Based Competitive bidding’. Here the Service Providers like KEC are responsible for Build, Own, Operate and Transfer of power lines. TSPs earn in the form of Transmission Charges payable by long-term customers.
  • Key players in the Power Transmission EPC are Areva T&D, Kalpatru Power, Jyoti Structures, Alstom Projects, and infra diversifieds like L&T, GMR and Reliance. A quick analysis shows among the listed focused firms, KEC has a 10-15% mkt share.
  • After a period of intense competition, we are now witnessing a consolidation favoring larger established players. The no. of players qualified for Power Grid’s new orders has come down to only three compared to at least 10 two years ago.

Unique strengths of KEC

  • Diversification of KEC beyond the Transmission EPC sector is good, as diverse businesses follow different cyclical patterns. Businesses set up in the last 3 years account for 27% of Orders Booked.
  • KEC has good presence beyond India, with 51% of current Orders Booked from other regions. In the last one year, KEC has also seen a resurgence of T&D demand from within India.
  • As the flagship RPG Group firm, KEC enjoys good management focus for its initiatives. Established in 1945 as Kamani Engineering Company, the firm has a rich past, and has again reinvented itself into a modern powerhouse. Ramesh Chandak, the MD & CEO is a CA and has lead KEC for the last 10 years.
  • Following the SAE towers M&A, KEC is now looking at additional acquisitions to accelerate growth.
  • Unlike many other Infra majors, KEC is very well managed financially with low leverage and good FCF

Stock Valuation, Performance and Returns

  • The share price has been volatile, moving from the all time high of 184 in Nov’07 to a low of 22 in Dec’08. Thereafter, the price has been affected by the overall low sentiment for infrastructure. Fig 3
Fig 3 – KEC Share Price History, JainMatrix Investments

Fig 3 – KEC Share Price History, JainMatrix Investments

  • KEC has shown a fine growth pattern (Fig 4) with revenues, but not with margins.
  • Sales have grown 19% CAGR over the last 5 years; EBITDA by 12% and Net Profit by 7% resp.
  • Operating margins had been around 10% previously. The recent high competition and entry into new sectors pushed it to around 6%. We expect this to steady at this level and slowly recover.
  • Typically the highest revenues are in the March quarter, due to the year-end of Govt. clients. Fig 4.
Fig 4 - Quarterly Sales and Profits, JainMatrix Investments

Fig 4 – Quarterly Sales and Profits, JainMatrix Investments

  • The dividend is Rs 1.2 for a FV of 2, giving a high Dividend Yield of 2.2%. Fig 5.
Fig 5 – KEC Share Price and Dividends, JainMatrix Investments

Fig 5 – KEC Share Price and Dividends, JainMatrix Investments

  • EPS has been growing at 7% CAGR.  Current PE at 9.2 is lower than Industry average of 15 times.
  • Free Cash Flow (FCF) however has been good.  It fell in FY11 primarily due to the SAE Tower acquisition. It’s been zero to positive for 4 out of last 5 years, and the highest in FY12. This is a very big positive for KEC, as unlike other infra companies, this is well managed financially. Fig 6.
Fig 6 – KEC, EPS and Cash Flow, JainMatrix Investments

Fig 6 – KEC, EPS and Cash Flow, JainMatrix Investments

  • The Price and PE chart is Fig 7. The PE ratio has a historical average of 17.5. It has moved in the range of 5-30 times across bear and bull phases of the market.
  • The current PE is 9.2 times. Current valuations are in the bottom quarter of a 6-year period. Definitely indicates undervalued status.
Fig 7 – Price and PE Chart, JainMatrix Investments

Fig 7 – Price and PE Chart, JainMatrix Investments

  • Price and EPS graph, Fig 8, shows that EPS accelerated till ‘08, then has been in the 5.5 – 7 range for the last 3 years. The recent fall was due to the investments in new sectors. My expectation is that EPS will grow in the sector drawn in this chart. Fig 8.
Fig 8 – Price and EPS Chart, JainMatrix Investments

Fig 8 – Price and EPS Chart, JainMatrix Investments

  • Consolidated Debt Equity at 1.01 (FY12) is low for an infrastructure firm. This is a positive.
  • Orders Booked to Billings, Fig 9, has been steady at 1.5 times.
Fig 9 – Orders Booked to Billings Ratio, JainMatrix Investments

Fig 9 – Orders Booked to Billings Ratio, JainMatrix Investments

  • Return on Capital Employed, ROCE, has been in a 22-36% range for the last 6 years.
  • Return On Net Worth, RoNW, also has been at 19-24% range. These are good numbers.
  • The Beta of KEC is 2.14 (Reuters) indicating high volatility compared to the Indices.

Peer Benchmarking

We have compared KEC with leading listed Peers, Chart 10:

Fig10 – Peer Benchmarking, JainMatrix Investments

Fig 10 – Peer Benchmarking, JainMatrix Investments

  • Relative to the peers, KEC has good ROCE and RoE numbers reflecting good financials.
  • D/E is good relative to peers. Valuations are not excessive. Price/ Book is low.
  • KEC comes out able to hold its own compared to Infra peers.

Risks

  • Domestic interest rates are expected to fall. A change there will affect our costs projections.
  • High competition in Power Transmission and Entry into new segments. Orders booked in the last 12-18 months in India have been at lower margins, but our projections assume an easing up of this.
  • Indian Power sector challenges. The key current issues are (1) financial stress among Utilities, particularly State Electricity Boards that are facing Tariff inflexibility and Collection issues, (2) Power Plants facing issues with fuel linkages and a shortage of Coal & Natural Gas, and (3) project execution delays due to government clearances like environmental, land acquisition, etc. This has affected the investment climate in this sector. The projects under execution by KEC are also affected, and execution/commissioning may be delayed.
  • Business uncertainty in MENA region – unrest and riots in this region can affect ongoing projects.
  • Unpredictable events like a European sovereign default, some new media issue/ bad publicity or any governmental charge sheet, etc. can occur that can mar equity performance for short periods.

Opinion, Outlook and Recommendation

  • India has a surging growth in electricity demand, yet there is a 9-13% power deficit today. This will widen in the next few years. Globally the thumb rule is that one rupee invested in generation must match an equal investment in T&D (1:1); however, in India it has been 1:0.5. There is now a huge opportunity for T&D players.
  • KEC should perform excellently based on the current strategy and execution capacities.
  • In 6 years, share price (adjusted) has fallen 12%, while the EPS growth is 7% (both CAGR). Other metrics like Sales, Orders Booked, Debt, etc too are favorable. The share is under-priced.
  • Current price is low due to poor sentiment/ pessimism in the Indian markets around the Power sector. However KEC is well placed to be a beneficiary of a sentiment revival.
  • In the next few quarters, a lot of pending Power transmission projects are to be bid out, and KEC should win a fair share of new business.
  • JainMatrix Investments values the company at Rs 82, so the share is available at a 49% discount
  • March 2014 target of 179, giving a 225% appreciation.

JainMatrix Knowledge Base

See other useful reports

  • Mahindra Holidays: Take this break !! – LINK
  • There’s nothing wrong with Apple Inc – LINK
  • Make Equity Investing less tricky: the JainMatrix Eleven – Link to Report
  • Yes Bank: The Brave Warrior of Indian Banks – Link to Report
  • Bharti Airtel: This is a year of consolidation – Link to Report
  • Arshiya International: A Collapsing Star – LINK
  • Adani Port – The Great Australian Adventure – Link to Report

Do you find this site useful?

  • Visit the SUBSCRIBE page to find how you can get more. Click LINK
  • Register Now to get our Free reports and much more, on the top right of this page, or by filling this Signup Form CLICK.

Disclaimer

These reports and documents are prepared by JainMatrix Investments Ltd. They are not to be copied, reused or made available to others without prior permission of JainMatrix Investments. Any questions should be directed to the director of JainMatrix Investments at punit.jain@jainmatrix.com Also see: https://jainmatrix.wordpress.com/disclaimer/