Indian Markets, Over or Undervalued? – A discussion

Summary: In this note, we debate on the current levels of the Indian markets, using several well-known ratios, in the context of local and global events. We are perhaps continuing from my previous Outlook article – Equity Outlook, Nov’20: Rising like a Phoenix from the Ashes

Introduction

  • The Markets are at an all-time high as Nifty crossed 17,000 levels and Sensex 58,000 levels. However, the Indian markets have been quite volatile in the last 2 years.
  • In this note we try to debate and understand the causes and effects, and if the markets are Overvalued or Undervalued at these levels.
  • Here are 20 year and 2 year charts of Nifty. Over 20 years, the Nifty has gained at 15.4% CAGR. Fig 1.
  • In Mar’20, the market fell sharply by 39% due to Covid fears, but recovered thereafter See Fig 2.

Fig 1 and Fig 2: Nifty (Source tradingview) – All charts are clickable

PROS: Reasons why the Indian Stock Market is Overvalued

1. The Covid pandemic has affected the Indian economy, yet the markets are booming.

  • The GDP growth in FY21 was -8%. In the second wave of May-July this year too the social and economic impact was hard. Inspite of this, the stock markets have risen. So, until the economy recovers, markets certainly look overvalued.

2. High P/E ratio of Nifty, as well as Midcap and Smallcap indices

  • PE of nifty was recently as high as 42 times, and even today at 28 times means that investors are paying ₹28 for ₹1 of earnings. See Fig 3. Before the 2008 market crash, Nifty PE ratio was 28.29.
  • Historically, a Nifty PE ratio of more than 25 means the Indian market is overvalued. 
  • Due to pandemic, there has been a fall in earnings of companies, even as the stock market rose. This was one of the main reasons why Nifty 50 touched life time high. For example, Reliance Ind. and TVS have shown steady growth but there has been a steep fall in earnings of companies like ONGC, Maruti Suzuki etc. which caused a large increase in Nifty PE ratio.
  • Cash influx by FIIs. During the pandemic, Central banks of USA and Europe printed cash in trillions as stimulus. The US Fed reduced interest rate to as low as 0.25%. FIIs started investing some of the cash in emerging markets like India for growth opportunities.
Fig 3: Nifty PE

3. Market Cap to GDP Ratio

  • This ratio is sometimes referred to as the Buffet indicator. It is a good way to check if the market is overvalued or undervalued compared to its past historical average.
  • Historically India’s Market cap to GDP ratio is 75%. A ratio of 100% is a sign of an expensive market.
  • Before the stock Market crash of 2008, the market cap to GDP was 103%.
Market Cap / GDPInterpretation
85% < ratio < 101%Moderately overvalued
Ratio >101%Significantly overvalued
Today’s level103% indicates Nifty is overvalued

4. Stock Market in a Bubble

  • In India, investors seem to be in a frenzy and attracted to the stock markets. Total Demat accounts have doubled in the last 2 years. What started as a hobby and pass-time during the lockdown, also encouraged by mobile apps by stock brokers, has grown into a massive wave. The IPOs are getting highly oversubscribed.
  • According to RBI, prices of risky assets have surged across many countries and have touched record high levels during 2020-21 on the back of unparalleled levels of monetary and fiscal stimulus.
  • The US Fed said the turn in market sentiments “following positive news on the development of and access to vaccines and the end of uncertainty surrounding US election results” were some of the major factors that led to increased valuation of global equities, also reflecting in Indian markets.
  • This asset price inflation in the context of 8% contraction in GDP in FY21 poses the risk of a bubble.

5. Debt to GDP Ratio

  • The central govt. total debt/ GDP at end of FY21 was 58.73%. High ratio indicates that the market is highly leveraged. During 2008 the ratio was highest and was 58.86%.
  • In a similar way, India’s total public debt (Centre and States) is likely to touch 90% of GDP in FY21, the highest ever recorded. In 2019-20, the total public debt to GDP ratio was 70%.
Fig 4: Debt to GDP ratio

6. Nifty Price to Book Value

  • It is the proportion of price to assets you own when you buy shares of a company.
  • The average long term Nifty PB is 3.5. Majority of the time, Nifty PB stays in the range 2-4 range.
  • It hit a peak of 6.55 during 2008.
If PB greater than  4Expensive
Between 2.75 – 3.5Fairly priced
Less than 2Cheap
Currently  PB ratio4.25

7. The monetary and fiscal stimulus has to end, followed by Global Tightening

  • With some recovery, the Fed and other Central Govts. have to draw back on the easy liquidity, raise interest rates, and the Indian stock markets will crash.
  • This is a likely scenario, but we cannot say if this will happen in the next quarter or next 4 years.

CONS: Reasons why the Indian Stock Market is still Undervalued

1. Reforms in the Indian Economy

  • A series of reforms in the last decade such as IBC, RERA, GST, crackdown on Black Money and investments in Digital and Fintech have happened and the benefits of these are unfolding.
  • Growth initiatives like ‘Make in India’ and ‘PLI for manufacturing’ have set the stage for higher employment, reduced imports and a stronger economy and self-sufficiency.
  • Govt. initiatives like controlling deficits, import substitution (in defense and monetization of gold assets) have strengthened the domestic economy.
  • The Digital Transformation of Indian Stock Markets, and the fall from grace of Indian Real Estate for investments.

2. The China + 1 Situation

  • The trade and political tension between USA and China has changed the equations in the last few years. USA had become dependent on China for a lot of manufactured products. With changing equations, it has become necessary for global firms to look at alternatives for manufacturing at scale. India is positioning itself as a good alternative by the Make in India and Production Linked Incentives (PLI) in manufacturing, extending from electronics, chemicals, defense, textiles, auto, etc.
  • In capital markets, China recently cracked down on several domestic sectors like steel, education, ecommerce, fintech, etc. Many foreign investors lost money as the changes in business ground rules were sudden and unexpected and based on China’s authoritarian system. China may thus become an unattractive option for global capital, and India may emerge as a stronger alternative.
  • These situations can result in India attracting high FDI and FII capital in the next few years.  

3. Because of Covid, many domestic sectors were affected, but are recovering fast

  • Sectors such as Travel & Tourism, passenger transportation, Hotels, Restaurants, Auto, mfg., Real Estate & construction are sectors still below pre-Covid levels. Banks have also suffered. All these sectors are expected to recover in 1-2 years, which will help improve earnings of the sectors.
  • The IMF has put India’s growth forecast as 9.5% for fiscal 2022 inspite of the second wave of Covid during Apr-Jun‘21. Chief Economic Adviser K V Subramanian said the economy is expected to stabilize to 8% growth in subsequent years.
  • Strong economic growth will drive up the Earnings, and reduce the high valuations of the market. Already we can see that the Nifty PE has fallen from 42 to 29 in just 2 quarters as the economy improves earnings and recovers from Covid, see Fig 3.
  • With better earnings, the high P/E ratio of Nifty, as well as Midcap and Smallcap indices will correct.

4. High Exports growth

  • India’s exports are growing very well in the last few quarters, in sectors such as gems and jewellery, petroleum, chemicals and engineering. The indications are of an economic revival in India and the country is on track to achieve $400 billion of goods exports this financial year and attract high FDI in FY22.
  • India’s foreign exchange position has strengthened in the context of the pandemic and India has been growing forex reserves at a record pace.
  • The INR has strengthened in the last few quarters, while there was a broad decline in the USD after the Fed Chairman said more progress was needed in the economy to withdraw stimulus.

5. Covid fears reducing, and global economy in a rebound

  • The second wave of Covid is receding in India. A third wave is possible, but we have already seen that the second wave was handled well by the administration and industry.  
  • Vaccination is scaling up in India and should cover a majority of the population soon. This will allow free movement of people, a return to work, and ensure a rapid recovery of the economy.
  • Post covid, the global travel will recover. Meanwhile in India IT based services and manufacturing are ramping up and supplying consumers in a global recovery.
  • A massive migration of workers in India from Urban centers to villages, is slowly reversing as jobs beckon across construction, logistics and retail. Education centers and offices are also reopening.
  • The high Market Cap to GDP Ratio may correct if the GDP rises as expected in next few years.
  • The Stock Market appears in a Bubble but it is in fact recovering from many years of under penetration of equity and slow growth. A new generation of younger investors are more optimistic and positive in their thinking.
  • The fiscal deficit would remain elevated over the next two years but the debt to GDP ratio is expected to stabilize or flatten out.
  • The private sector has been underinvested in Capacity and Capex in the last decade. With lower interest costs and higher growth expected, the private sector is making capex plans. If the trend accelerates, the Price to Book Value will reduce.
  • The stock market is forward looking. It anticipates higher GDP and growth in the next few years, and the Nifty levels reflect this optimism.

Conclusion

  • As an investor in the Indian markets over the last 15 years, I have always believed in the growth story and the resilience of the market. At around $1947, the Indian per capita income is low. Given the freedom, global connects and govt. initiatives, the economy should be able to achieve over 7% GDP growth over the next few years. Except for the informal sector and unlisted space, much of this growth should translate into gains for the stock markets in India.
  • The Indian economy has been reset by the Covid infection. However most businesses have been able to adjust and adapt to it in terms of prevention and resolution. It’s not business as usual any longer. The people and businesses are back, stronger than ever, and with a new urgency.
  • Assuming a full recovery for the economy over the next year and good growth thereafter, the markets will stay positive. Given the context of excellent liquidity, low interest rates and a benevolent, growth oriented, stable policy environment, the Indian markets can continue to rise.
  • Markets are unpredictable in the short term, but participants and investors can expect good returns in a 3-5 year period horizon.  

Disclaimer

This document has been prepared by JainMatrix Investments Bangalore (JM), and is meant for use by the recipient only as information and is not for circulation. This document is not to be reported or copied or made available to others without prior permission of JM. It should not be considered or taken as an offer to sell or a solicitation to buy or sell any security. The information contained in this report has been obtained from sources that are considered to be reliable. However, JM has not independently verified the accuracy or completeness of the same. Neither JM nor any of its affiliates, its directors or its employees accepts any responsibility of whatsoever nature for the information, statements and opinion given, made available or expressed herein or for any omission therein. Recipients of this report should be aware that past performance is not necessarily a guide to future performance and value of investments can go down as well. The suitability or otherwise of any investments will depend upon the recipient’s particular circumstances and, in case of doubt, advice should be sought from an Investment Advisor. Punit Jain is a registered Research Analyst under SEBI (Research Analysts) Regulations, 2014. JM has been publishing equity research reports since Nov 2012. Any questions should be directed to the director of JainMatrix Investments at punit.jain@jainmatrix.com.

Cryptocurrency – Or is it a CryptoCommodity?

Date: 16th June 2021

Summary

  • There is an excitement around Cryptocurrency (CCS) – a combination of high potential gains, high tech backbone, a novelty, and a rebelliousness, that has attracted investors and driven demand. While initial purchases were by professional traders, speculators, crooks and gamblers, the ecosystem and exchanges have been helping to simplify and popularize it.
  • The success of an asset class like CCS will be largely driven by regulations, and demand – supply. Regulations are now by and large benign. So far the demand has exceeded supply, but in June 2021 we are in a very positive investing cycle across stocks, commodities and CCS. A reversal will challenge CCS price trends.
  • If the two major issues around CCS of – 1) too many coins options and 2) high wastage of electricity for CCS mining and processing – are addressed, CCS has the potential to become a widely used and stable currency.
  • Until this happens, CCS has characteristics closer to global commodities, hence our term, CryptoCommodity.
  • Investing now into CCS is for professional traders, those with a high risk appetite, and who can see as much as a 50% fall in value, at least temporarily. Some experts suggest a maximum 5% of investible funds to be allocated to this asset class.
  • Past report on Cryptocurrency available A Note on Cryptocurrency

Introduction

  • The story of cryptocurrency (CCS) and blockchain technology began in the year 2008 when the globe was going through the financial crisis. We saw the fall of Lehman brothers, rising unemployment, and the bubble burst. Meanwhile, Satoshi Nakamoto founded bitcoin which was the first decentralised currency in the world valued at $0.0008, which is currently trading at $38,700. Also see Market caps of Coins in Fig 1a.
  • In the past 12 years of CCS market, many new coins were introduced that have almost disappeared. On the other hand, Dogecoin that was promoted by Elon Musk, helped it to rally very high just by his tweets.

Fig 1a- Market Capitalization in USD B / and Fig 1b – Volatility of Asset classes

  • CCS are digital currencies that utilize blockchain technology to provide improved security, anonymity, and decentralization. There is no central authority for CCS, and no third parties needed to facilitate transactions.
  • In Fig 1b, we compare Bitcoin with Gold and US equities in terms of volatility and drawdowns over 10 years. Bitcoin has the highest drawdowns, showing that it is more risky. 
  • Transactions are highly secure and independent. The most famous CCS, the blue chip cryptos, are Bitcoin and Ethereum. They have market capitalizations of ₹50.3 lakh crore and ₹22.6 lakh cr. resp.
  • Bitcoin, Ethereum and Dogecoin have rallied 2.7X, 9.4X and 133X resp. in a one year time frame. See Fig 2a.
  • CCS offers more confidential transactions with least transactions fees involved and provides more lucrative opportunities for easier international trade.
  • But CCS has some adverse effect on environment in terms of consumption of more power and electricity for mining which made Tesla to withdraw from Bitcoin as a payment option.
  • Even though CCS is decentralised, but they are still several powerful operators, who can manipulate the prices, and we can see huge dips and bounces in the market.

Fig 2a – BTC movement last 5 years and Fig 2b – In 1 year (Sources – Statista and Coinbase)

Recent News and Events

  • Recently RBI had issued notices to banks which gives relief to Indian crypto investors, allowing transactions in CCS but it needs to be regulated under KYC, Anti money laundering and combination of Financing of terrorism, Prevention of money laundering Act (2002).
  • The El Salvador Congress on June 9 approved a bill making the world’s largest CCS, Bitcoin, legal tender in the country. The Central American country is now the first ever to make Bitcoin legal tender.
  • Last month US CCS exchange Coinbase successfully listed on the Nasdaq stock exchange. This listing could stabilize CCS, change the perceptions of individuals and make the future bright for the industry. Coinbase also faces competition from Binance, the world’s largest crypto exchange, as well as decentralized exchanges like Uniswap, which handle more trading activity than Coinbase.
  • U.S Treasury calls for stricter CCS compliance with IRS as they pose tax evasion risk. Treatment of this in India is unclear. GoI has constituted a panel to develop crypto regulations for India.
  • China has taken a decision to ban financial institutions and payment companies from providing services for crypto transactions and has warned investors against speculation and volatility. This news led to bitcoin falling 50% from the years high to the lowest since February, See Fig 2a and 2b.
  • With the initial few CCS taking off, many new coins were being introduced in the form of ICOs (Initial Coin Offers). However this market became frothy and by Nov 2017, there were around 50 ICO offerings a month.
  • Indian blockchain start-up Polygon, is the first well structured, easy to use platform for Ethereum scaling which aims to provide faster and cheaper transactions on Ethereum. Mark Cuban a US based entrepreneur has invested an undisclosed amount in the Polygon Matic coin, which hit a new high market cap of $14 B.
  • Tesla allowed Bitcoin as payment option for purchasing vehicles, but later Elon Musk removed the option as there was significant increase in mining of the CCS after his announcement.
  • As technical outlook remains positive and strong, Bitcoin is expected to reach $4,00,000 level in 2021 as per Bloomberg. Many investors have added an exposure to CCS as a small part of their assets.

CRYPTO v/s GOLD

  • Gold is a traditional global store of value; Cryptos are new
  • Gold is physically heavy, difficult and costly to transport; CCS are instantly transferred
  • Country wise restrictions or taxes for import or export; CCS are digital and generally permitted
  • Gold is well established and regulated; CCS has low to medium clarity on rules and regulations
  • A rise in gold prices over the past 50 years; CCS/ Bitcoin has seen massive rally over last decade
  • Gold has been a protection against large risks like war and infection; also provides safety against inflation
  • CCS is itself volatile, so is not yet a safe store of wealth, but more is itself a high risk, potentially high gain asset
  • CCS can in future become a major threat to gold in global wealth and savings

CRYPTO v/s CURRENCIES like USD or INR

  • Cryptocurrency is weak as a currency due to high volatility.
  • Central banks stabilize their currencies and hedge against other asset classes to smoothen the spikes. Year on year movements reflect Trade balances and the strengths of their economies.
  • However CCS is increasing being accepted for purchasing on websites and as a medium of exchange. 
  • But it is right now being used as a speculative investment by itself.
  • CCS may evolve in time as a store of value and as an alternative to other stores of value.

CRYPTO v/s COMMODITIES like Crude Oil, Steel or Copper

  • The volatility of CCS can be compared to some global commodities.
  • Global commodities have supply restricted by mining and mfg. constraints and fluctuate in line with demand and supply.
  • Trading of global commodities happens rapidly on global exchanges but fulfilment and logistics to back the transactions of course require time.
  • Global commodities have an inherent utility and so trading of these is essentially the matching of producers with consumers, with a small fraction of speculative trading also happening.

Top Cryptocurrencies to invest in 2021

  • There are by now a large number of CCS, see Fig 3a below for a list.
Fig 3a – Cryptos
  • Of the options, we share a suggested ordered list of CCS for traders.
  1. Bitcoin
  2. Ethernum
  3. Cardano
  4. Ripple
  5. Polkadot
  6. Bitcoin Cash
  7. Tron
  8. VeChain

How to invest in cryptocurrency in India

  • There are lot of India available platforms like WazirX, CoinDCX Go and Coinswitch Kuber, etc. An investor can download the app, open an account by providing personal details, identity proof like Aadhar or PAN card. These apps are available in Play store and Appstore. Once the account is verified, the customer can link their bank account and add money to the wallet in the app using Mobikwik or bank transfer. See Fig 3b.
  • Once the balance reflects in the wallet, the customer can purchase coins available by just clicking to buy.
  • Purchased coin will be shown under My Investments. The platforms are user friendly and simple to navigate. See Fig 3c.
Fig 3b – Payment Transfer and Fig 3c – Buy the coin

Key Advantages & Disadvantages

Opinion and Outlook

  • There is an excitement around CCS – a combination of high potential gains, high tech backbone, a novelty, and a rebelliousness, that has attracted investors and driven demand. While initial purchases were by professional traders, speculators, crooks and gamblers, the ecosystem and exchanges have been helping to simplify and popularize it.
  • The success of an asset class like CCS will be largely driven by regulations, and demand – supply. Regulations are now by and large benign. So far the demand has exceeded supply, but in June 2021 we are in a very positive investing cycle across stocks, commodities and CCS. A reversal will challenge CCS prices.
  • If the two major issues around CCS of – 1) too many coins options and 2) high wastage of electricity for CCS mining and processing – are addressed, CCS has the potential to become a widely used and stable currency.
  • Until this happens, CCS has characteristics closer to global commodities, hence our term, CryptoCommodity.
  • Investing now into CCS is for professional traders, those with a high risk appetite, and who can see as much as 50% fall in value at least temporarily. Some experts suggest a maximum 5% of investible funds to be allocated to this asset class.

Disclaimer

This document has been prepared by JainMatrix Investments Bangalore (JM), and is meant for use by the recipient only as information and is not for circulation. This document is not to be reported or copied or made available to others without prior permission of JM. It should not be considered or taken as an offer to sell or a solicitation to buy or sell any Cryptocurrency or related app. The information contained in this report has been obtained from sources that are considered to be reliable. However, JM has not independently verified the accuracy or completeness of the same. Punit Jain has no cryptocurrency assets as on date. Neither JM nor any of its affiliates, its directors or its employees accepts any responsibility of whatsoever nature for the information, statements and opinion given, made available or expressed herein or for any omission therein. Recipients of this report should be aware that past performance is not necessarily a guide to future performance and value of investments can go down as well. The suitability or otherwise of any investments will depend upon the recipient’s particular circumstances and, in case of doubt, advice should be sought from an Investment Advisor or cryptocurrency specialist. Punit Jain is a registered Research Analyst under SEBI (Research Analysts) Regulations, 2014. JM has been publishing equity research reports since Nov 2012. Any questions should be directed to the director of JainMatrix Investments at punit.jain@jainmatrix.com.

The Indian Stock Markets’ 20 year Digital Transformation

Indian Stock Markets

It was about 20 years ago. I asked a relative about the stock markets. I got mixed stories.

On one hand 2-3 of their investments had done well and doubled in a few years.

On the other hand there were stories of (the Challenges)

  1. share values falling to almost zero, there were missing promoters or company locked in litigation
  2. difficult stock brokers. To know a good broker was rare. They were bullies, took your share and sold it and gave you money after a month; the transaction was opaque; you would be lucky if you only paid 4-5% commission on transactions.
  3. The stock market was famous for scams aplenty. The Harshad Mehta scam (1992), the Ketan Parekh Scam, the Satyam Scam, Saradha Scam and NSEL Scam, among other swirling stories of manipulation and operator driven shares naturally made outsiders wary. BSE had been in existence for a long time, and this was the nature of the market.
  4. A stock market transaction had a high degree of difficulty and uncertainty.

But it had piqued my interest. So a few years later when a new private bank offered me a website based stock broking account as an add on to the savings account, I went ahead and opened it.

Over the next few years, we saw a number of Equity Market Changes:

  1. The NSE came into existence with a digital trading offering
  2. Equity Shares began getting dematerialized. Once they were in Demat form, trading could be on the digital platform, quickly and cheaply
  3. SEBI as regulator began controlling and monitoring the sector’s progress
  4. A number of stock brokers came into existence, and with competition, broking commissions became reasonable.
  5. BSE and NSE had good digital backbones, so trading moved online
  6. The Mutual Fund industry took off, offering a simple entry level product for new investors
  7. Soon enough, the Equity Advisory, PMS and even AIF industries and products became available.

The digital transformation has dramatically changed Stock Market access, monitoring and information flow.

With these Equity Market industry changes, the nature of services available to the customer changed. The above Challenges were addressed:

  1. Share prices are still volatile. Some firms do fail/ go bankrupt. However, it does not happen in an information vacuum. We can track companies better today. Conversely, excellent companies do see good share price appreciation.
  2. Stock broking accounts can be opened easily. Transactions are easy, robust and transparent. Commissions are lower and competitive. Stock brokers are now much better, customer friendly and professional.
  3. Our Securities system has improved. The digital transformation has dramatically changed access, monitoring and information flow. Every scam perhaps made the system stronger eventually, as the loopholes found were blocked, (and hopefully that problem should not happen again). Of course there is no guarantee that there will not be another scam, but the stock market is a much safer place now.
  4. A stock market transaction is easily done now on websites, accessible from your PC, laptop, by phone call and even using mobile apps.

So a lot of people from my generation were afraid of the stock markets. The stories they heard from their friends and relatives were scary. Some people lost a lot of money and swore to never touch the sector again. However my message to them is:

Today the Indian Stock Markets are a very good Wealth option to all.

Its not too late. Take the plunge, and explore the stock markets for your wealth protection and appreciation.

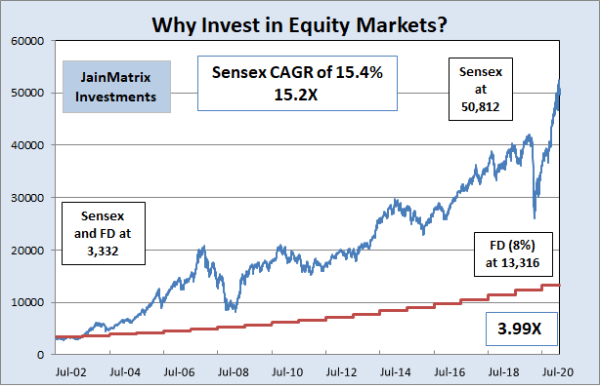
To substantiate this, I present a simple 20 year graph of the SENSEX index

In this graph, one can see the performance of a Fixed Deposit (at 8% interest) versus the Sensex, in both absolute value and in the form of multiples.

Real Estate

The traditional Indian Wealth option has been Real Estate. People bought Land, apartments and commercial property, and waited for it to appreciate. Or developed it, and very often reaped excellent returns. For many years it appreciated very well.

Then came a couple of changes in the real estate sector:

  1. GST was brought in to track and tax real estate transactions
  2. RERA Act was brought in to make builders professional, accountable and transparent. It has been changing the way they work. Customers may finally have some protection or recourse now from builder slippages. However several builders could not change and adapt to the new rules, and may have scaled down or even closed.
  3. Several initiatives against black money have made real estate transactions more ‘white’ than they have ever been in the past.
  4. Today even after some correction, we can see that a buy v/s rent decision, for a city apartment, is still unbalanced. The EMI for an apartment purchase (with loan) is much higher than the rental cost for a similar property. In most mature markets abroad, the EMI and Rent are close or in some balance with each other.
  5. All this has resulted in a Time and Price correction in the real estate sector across categories. We can see that today this is still playing out. As a result:

Real Estate is no longer the default Wealth option it once was. Do try other options.

In 2020, 55% of adults in the United States invested in the stock market. Today in India, this is just 2%.

This is not going to change overnight for India, but as awareness builds, individuals must try and nibble at stock markets and educate themselves on its potential.

I have managed to do OK with my website based stock broking account. I became a full time investment professional in 2012. My firm JainMatrix Investments offers an equity advisory service to help invest in the stock markets. See our SERVICE DETAILS section.

Do revert to me if you have any questions on above article.

Regards,

Punit Jain

Founder, JainMatrix Investments

Glossary: I often use standard terms or shortforms so here is some explanation:

  • PMS – Portfolio management service
  • AIF – Alternative Investment Fund
  • EMI – Equated Monthly Installments, as in repayment for a loan
  • GST – Goods and Services Tax
  • RERA Act – link

DISCLAIMER

This document has been prepared by JainMatrix Investments Bangalore (JM), and is meant for use by the recipient only as information and is not for circulation. This document is not to be reported or copied or made available to others without prior permission of JM. It should not be considered or taken as an offer to sell or a solicitation to buy or sell any security. The information contained in this report has been obtained from sources that are considered to be reliable. However, JM has not independently verified the accuracy or completeness of the same. Neither JM nor any of its affiliates, its directors or its employees accepts any responsibility of whatsoever nature for the information, statements and opinion given, made available or expressed herein or for any omission therein. Recipients of this report should be aware that past performance is not necessarily a guide to future performance and value of investments can go down as well. The suitability or otherwise of any investments will depend upon the recipient’s particular circumstances and, in case of doubt, advice should be sought from an Investment Advisor. Punit Jain is a registered Research Analyst under SEBI (Research Analysts) Regulations, 2014. JM has been publishing equity research reports since Nov 2012. Any questions should be directed to the director of JainMatrix Investments at punit.jain@jainmatrix.com.

Indian PetroTaxes, the Dharam Sankat – A Solution

Introduction

In this public interest article, JainMatrix Investments ideates on the Oil & Gas sector. In India, currently the retail prices of petrol & diesel are at all-time high. On 16th Feb’21, petrol cost ₹ 89.29/liter in Delhi, while diesel cost ₹ 79.70/L. In some parts of India, like Raj. and MP, petrol crossed the ₹100/L mark for the first time. This is of concern to the retail consumer. There is also a cascading effect of diesel prices impacting transportation, and truck rental and bus / taxi prices are rising.

Background

These products are not covered under GST, which has set tax slabs. The price build-up of petrol can be well understood from Fig 1. Govt. of India (GoI) has increased taxes on petrol & diesel over 5 years, to raise revenues, discourage excessive use & promote usage of environment friendly Electric Vehicles, see Fig 2.

Fig 1 – Price Build up of Petrol, Fig 2 – Excise and VAT (Source ToI)

Volume and Crude price volatility: Due to pandemic effect, the sales volume of diesel reduced by 10 M tons compared to the previous year. Crude prices also fell steeply as global demand fell, see Fig 3. To meet the budgeted FY21 Tax collection of ₹ 16.35 lakh cr., GoI had to raise excise duty on petrol by ₹13/L and on diesel by ₹16/L in two tranches. By Sept-Oct 2020, crude prices rose again, and Indian retail prices have risen to new highs.

Thus the problem is that collection of taxes (state VAT & center’s Excise Duty) is fixed by GoI assuming fixed base prices & sales volume of petrol & diesel. These 2 main factors contribute to petro price volatility: 1) Crude prices 2) Sales volumes.

The Finance Minister has referred to this situation as a ‘Dharam Sankat’. We have a Suggestion.

Fig 3 – Crude Prices (Source: TradingView)

Suggestion

  • This problem can be resolved by having monthly resets of Excise and VAT from petrol & diesel.
  • Thus the Union Excise Duties budget of ₹ 3.61 lakh crore (assumed from petrol & diesel) can be taken as ₹ 30,083 cr. /month. Similarly states’ VAT.
  • Every month, the VAT and Excise charges per liter can be modified to meet the monthly budget, based on last month’s collections, and petro sales volumes. Any monthly variance of collections from budget can be rolled over and made up in next month, so that the budget is achieved.
  • Naturally the states and center need to coordinate for the monthly tax reset task. Perhaps the infra is already in place, as PSU firms change prices rapidly when crude prices change.

Benefits

  • This system allows an auto correction of tax levels – excessive tax collection one month results in lower taxability next month so that over 2 months the budget is maintained. And vice versa.
  • As the Indian economy recovers, we feel that petro product consumption volumes will rise. The above system will trigger lower per liter prices in this scenario.  
  • It’s important that the GoI does not excessively tax petrol and diesel, and stay within budget, while also recognizing that petro products are an important way for GoI to control deficits post the covid year.

DISCLAIMER

This document has been prepared by JainMatrix Investments Bangalore (JM), and is meant for use by the recipient only as information and is not for circulation. This document is not to be reported or copied or made available to others without prior permission of JM. It should not be considered or taken as an offer to sell or a solicitation to buy or sell any security. The information contained in this report has been obtained from sources that are considered to be reliable. However, JM has not independently verified the accuracy or completeness of the same. JM has no known financial interests in any of these firms. Neither JM nor any of its affiliates, its directors or its employees accepts any responsibility of whatsoever nature for the information, statements and opinion given, made available or expressed herein or for any omission therein. Recipients of this report should be aware that past performance is not necessarily a guide to future performance and value of investments can go down as well. The suitability or otherwise of any investments will depend upon the recipient’s particular circumstances and, in case of doubt, advice should be sought from an Investment Advisor. Punit Jain is a registered Research Analyst under SEBI (Research Analysts) Regulations, 2014. JM has been publishing equity research reports since Nov 2012. Any questions should be directed to the director of JM at punit.jain@jainmatrix.com.

Indian IT Services Sector – Add the Digitals

JainMatrix Investments presents an Industry report on the Indian IT Services sector. It’s a sector that is growing at 8-10% annually and has significant share in global outsourcing. An ecosystem of good college education and a large pool of talent, feed a clutch of globally competitive Indian IT Service firms. The digital demand has only grown post-covid, so the industry is looking at many years of global growth in early double digits. See the Conclusion section for our recommended IT Services portfolio.

We make our 11th Jan 2021 IT Services sector report public for your investing pleasure and success.

jainmatrix investments, IT Services

Additional sector reports:  Happiest Minds IPO – Ride the Digital Wave – Sept 2020    

                                               LT Tech Services IPO – The Make in India Firm – Sept 2016

Introduction and Profile

  • Indian IT services industry started over 30 years ago, but is now very large with revenues US$ 191 billion (INR 14 lakh crores). About 81% of revenues are from exports. See Fig 1a.
  • It has 17,000 firms & is an emerging global hub for Digital Skills, with 75% of global digital resources.
  • IT Services have contributed 7.7% to the India GDP in 2019 which is expected to grow to 10% by 2025 (IBEF). In FY19, the industry employed 41 lakh people. It is also fueling innovation, as there are around 5,300 tech start-ups in India.
  • Exports rose at a CAGR of 8.05% during FY16-19. Export of IT services has been the major contributor, accounting for 54% of total IT export (including hardware) during FY19.
  • Globally, the sector is headed towards achieving USD 1 trillion (INR 75 lakh crores) of revenues by 2022.

Fig 1a – Market Size in India and Fig 1b – Share of Demand by Country

  • USA dominates global Country Share of demand, with EU, China and Japan coming next, see Fig 1b.
  • In Fig 1b, market share of Indian IT industry looks small but this is domestic demand in USD. India is a dominant supplier of IT services globally and has the fastest growing industry in the world with most key players having a HQ or development centers here.
  • BFSI is a key business vertical for IT & BPM industry, in terms of major revenue-share. Adoption of new technologies is needed for growth & competitive advantage in Banking & Insurance domain.
  • Other important sectors are Life Sciences & Healthcare, Retail & CPG, Communications & Media, Manufacturing, Telecom and Technology & Services.
  • Indian IT industry’s USP is cost competitiveness, good skills, resource availability and project management skills for providing IT services.  
  • Tier II and III cities are gaining traction among IT firms aiming to grow business in India, facilitated by skilled local resources, affordable real estate, favorable Govt. regulations, tax breaks and SEZ schemes. A hub and spoke model is developing with Tier I city as hubs and tier II, III and IV as spokes.
  • India is a top location for Global Capability Centers (GCCs), which concentrate on workers and infra to handle operations (back-office, corporate business-support, accounting & finance, transaction processing and contact centers) and IT support (app. development and maintenance, remote IT infra, and help desks), to enhance productivity. Some large companies use GCCs as a center of excellence for innovation and research.
  • About 70% of India-based GCCs belong to US companies, 20% European and 10% Asia-Pacific.
  • According to Nexdigm, India is home to over 1,750 GCCs, which is 50% of all such centers globally. GCCs here employ over 10L employees, generating a total economic value of around $28.3 billion.
  • IT Services in India are growing at a fast pace due to the globally competitive firms that provide world-class services. The Human talent pool available in India is highly skilled and trainable, a key strength of the IT Services sector. The IT infra here has also developed to global standards.

IT Sector Progress and News

  • NASSCOM (National Assn. of Software & Services Cos.) launched an online platform to up-skill 40 lakh tech professionals. It partnered with GE Healthcare for digital healthcare solutions for the market.
  • IT service firm DXC Technology, will set up its first global analytics unit in Bengaluru.
  • Govt. of India (GoI) announced a national program on AI (artificial intelligence) and a new National AI portal. GoI has identified IT as one of 12 champion service sectors for developing an action plan. It has set up a ₹5,000 crore ($ 745 m) fund for realizing the potential of these champion service sectors.
  • As of Feb’20, there were 421 approved SEZs (Special Economic Zone) across the country, and of these, 276 are from IT & ITeS. These provide tax incentives for exports. Software Technology Parks of India (STPI) has set up 57 centers for single window clearance and infra facilities, and for Excise Duty exemptions on buying local goods.
  • Technology for many businesses was considered a support function. This has changed as tech. has become business critical, enabling employee productivity, revenue growth from eCommerce, cost savings and faster customer support & communication.
  • TCS took the #1 spot with M-cap of $144 b among IT Services organizations, dethroning Accenture which is trailing by just $1b (Dec ‘20).

Impact of Covid

  • In Q1FY21, Indian IT sector has emerged as a winner post lockdown. With Work from Home (WFH) at 95%, all the big IT firms saw robust demand from clients, particularly cloud & automation. Infosys gained in revenue and profits; IT index gained 22% in July. Similarly in Q2FY21, IT sector gained due to increased tech spending by clients in digital transformation.
  • Due to automation, spending on IT infra has outpaced HR. Job creation has been limited with offers being rolled out more on contractual basis than full-time, in both emerging & developed markets.
  • Many firms found that WFH employees are equally productive & this saves real estate costs as well. It also relieves firms of covid related responsibility and litigation.
  • IT Deals – Indian IT stocks jumped by 50%, on an average, between Mar-Sept ’20. Top IT firms have been closing deals – Infosys closed 2 big deals, Vanguard and Consolidated Edison (digital transformation); TCS won deals from Phoenix Group (life insurance and pension) for client analytics tool, and Morrisons (retail); Wipro from Marelli (auto software engg.) and HCL Tech from Ericsson.
  • Broker comments: Girish Pai of Nirmal Bang said that global clients shifted spending from internal IT, selling, general and administrative (SG&A) and hardware, to outsourcing and digital, to speed up the digital transformation processes such as migration to cloud.
  • Motilal Oswal, a brokerage firm, said that demand & utilization has normalized to pre-Covid levels with discussions being revived for deferred deals and margins expected to be resilient as well.

Relative Price Performance

  • The graph in Fig 2 – Relative Share shows the stock returns given by listed Indian IT Services firms over Oct’18 – Jan’21.
  • We can see that performance was steady for these firms till early 2020 in a +25 to -10% ranges, then there was a sharp fall due to Covid. Recovery came by July’20 and in next 6 months there was a dramatic price rise for many of them.
  • On the right side we can see the resultant share performance by order for the 2+ years.
  • Among large caps, L&T Infotech is #1, marked L1, Infosys #2, HCL Tech #3 and next are Wipro #4, TCS #5 and Tech Mahindra #6. Among mid-caps, the rankings are Persistent is #1, marked M1, others are Mindtree #2, Mphasis #3, LTTS #4 and Sonata Software #M5.
  • Even so, the entire IT Services pack has performed very well as even the lowest performance was 42% gains over 2+ years, while the highest is an amazing 179% gain.

Fig. 2 – Relative Share Price

Large Cap Firms – Benchmarking and Sales Charts

Fig 3a – LC revenue and Fig 3b – MidCap

In Fig 3a we map the FY20 revenues for Large Cap Firms. Revenue from exports is the major source.

  • TCS has the highest sales by value, almost two-fold to the nearest competitor Infosys.
  • In terms of India revenues, Tech Mahindra has the highest domestic sales followed by TCS.

Fig 4a – LC Benchmarking

  • In Fig. 4a – Benchmarking, we compare large cap IT services firms on key financial parameters.
  • The leader is marked in green and the laggard in red. The sum total of these parameters is the Score.
  • We can see that TCS is a clear leader, including RoCE and Return of Equity, while Wipro lags on this comparison amongst 6 large cap firms. L&TI however appears as a growth and profit leader.

Mid-Cap Firms – Benchmarking and Sales Charts

  • In a similar manner, we compare mid cap IT services firms. In Mid-cap basket, Sonata is the leader on financial parameters, including RoCE and RoE, whereas Persistent lags among the 5 firms.

Fig. 4b – Mid-caps Benchmarking

  • Among mid-caps, Mphasis has the highest revenues or sales, followed by Mindtree.
  • Sonata Software has the highest domestic sales by value and proportions.
  • Fig 4b above captures the MidCap firms revenue by domestic and exports.

Future of the Indian IT Services Industry

  • The comparative advantages of the country are – young population, good college education and ample science and technical courses. These feed this sector with quality resources.
  • India is developing as a critical part of execution and delivery of global business and IT Services, across industries & locations. Firms like TCS are covering more countries & expanding the market.
  • The growth of Telecom networks like 2G-4G and now 5G are bringing the world closer.
  • Covid has actually accelerated the rise of digital, eCommerce, internet and the IT Services industry. As larger firms enforced WFH for their employees’ safety, the physical presence has become unnecessary for work, for large swathes of industry. 
  • TCS as the #1 firm globally in terms of market capitalization has been able to sustainably mix high margins, high growth and a global vision. The other firms in the industry are growing in its wake and developing their own niches and strengths.
  • The industry is looking at many years of global growth in early double digits, even as IT services take early baby steps of growth in its own backyard, India. With programs like Aadhar card, UPI payments, GST, digital tax filing and FASTag, technology is proving the best way to transact at scale with speed and transparency, and also reduce corruption.
  • The success of the Indian IT Services firms has spawned the second generation of services firms such as Syngene Intl. (pharma R&D) and Tata Elxsi & LTTS (Engineering R&D) which are niche services players by technology or industry.
  • The key new IT services trends are WFH, cloud services, AI, IoT, robotics, mobile apps and machine learning.

Conclusion:

  • IT Services firms are always going to be needed to stitch together solutions for large Enterprises, and to help them navigate, evaluate and deploy in complex IT landscapes with multiple technology options.
  • Indian IT services companies have time and again proven their mettle and have the skilled resources and project management skills to deliver successfully. It is a dynamic, globally focused sector.
  • The 11 firms had an excellent share price performance range of 42% to 179% gains over 2+ years.
  • The weak INR may help India to continue to be a good base for service delivery teams and exports.
  • Large Caps: A LC IT Services portfolio will be more stable and safer for investors. We conclude from Fig 2, Fig 3a, and Fig 4a that of the 6 LC firms, the best 3 are L&T Infotech, TCS and Infosys.
  • Mid-Caps: A MidCap IT Services portfolio will be more volatile, but possibly provide better returns. We can see from Fig 2, Fig 3b and Fig 4b that of the 5 LC firms, the best 2 are Mindtree and LTTS.  
  • We recommend investors to buy this 5 firm portfolio in an equi-weight mode.

Disclaimer

This document has been prepared by JainMatrix Investments Bangalore (JM), and is meant for use by the recipient only as information and is not for circulation. This document is not to be reported or copied or made available to others without prior permission of JM. It should not be considered or taken as an offer to sell or a solicitation to buy or sell any security. The information contained in this report has been obtained from sources that are considered to be reliable. However, JM has not independently verified the accuracy or completeness of the same. Punit Jain has equity holdings in LTTS, Sonata Software, TCS and L&T Infotech, all <1%. Punit Jain has worked at TCS (1995-2002) and in Sonata Software (2003-2012). Other than this, JM has no known financial interests in any of these firms. Neither JM nor any of its affiliates, its directors or its employees accepts any responsibility of whatsoever nature for the information, statements and opinion given, made available or expressed herein or for any omission therein. Recipients of this report should be aware that past performance is not necessarily a guide to future performance and value of investments can go down as well. The suitability or otherwise of any investments will depend upon the recipient’s particular circumstances and, in case of doubt, advice should be sought from an Investment Advisor. Punit Jain is a registered Research Analyst under SEBI (Research Analysts) Regulations, 2014. JM has been publishing equity research reports since Nov 2012. Any questions should be directed to the director of JM at punit.jain@jainmatrix.com.

How is India doing against COVID19 in 3 graphs

Its been 3 months since Covid infection hit India. I believe India has done well so far. But lets check out the facts using just 3 graphs in Logarithmic Scale. (click to expand image)

  1. India’s COVID-19 Curve, compared to other countries. (Source visualcapitalist.com)
  2. Total Coronavirus Cases in India (Source: worldometers.info)
  3. Total Coronavirus Deaths in India (Source: worldometers.info)

jainmatrix investments, India on Covid

Thoughts? Comments? Please share below.

Regards, Punit Jain

Expectations and Thoughts on a New India – Post Elections Note

Date: 1st June 2019

Recent Events – Elections

  • Last week we had an election result day and the 2019 central election came to a dramatic end. We welcome the second term of BJP and the National Democratic Alliance at the center.
  • The 6 week long 7 phase election was an emotional, high decibel multimedia war among the parties and participants. I am so glad we fight this way. People argue, they criticize, they pull up history, they express themselves, and they get angry. They decide whom to vote for. Then they stand peacefully in a line to vote, and accept the outcome.
  • This is far better than a civil war or an agitation or a set of bandhs and protests. Thank you India. :-)

THE Economic Environment

  • Growth is slowing in the Indian economy to 7% and below. This is weak as we have a low per capita GDP. To absorb the population growth in jobs, we have to target 8% plus growth.
  • The slowdown is a culmination of multiple events – high interest rates relative to inflation; weakness in sectors like real estate, automobiles, consumption and low rural demand. BFSI sector has issues like a liquidity challenge affecting NBFCs, NPA issues in PSBs and the IL&FS crisis. Exports have slowed down as global demand is down due to weak growth and a tariff war between USA and China. The private sector is not investing.
  • Even though the above laundry list of issues is depressing, the economy also has a number of positives. Our IT and ITES sector continues to bloom. Sectors like pharma, automobiles, telecom and retail have achieved impressive scale. The large corporates have in general improved balance sheets and are low on debt. Private sector does have investment firepower in place if they see good opportunities. We are past several difficult structural reforms like GST, RERA, demonetization, shell company crackdown and Bank NPAs, and with this election result market uncertainties are much lower. We have rich human resources and need to tap this well.
  • Corporate India has to grip the large opportunities up for grabs – housing, infrastructure push from govt. including roads, railway, airlines and airports, gas distribution and water supply, mobile and telecom based opportunities, consumption by a large population, eCommerce, digital and Aadhar validation based business models.

A Wish List for Modi 2.0

As an investor, I have many hopes and expectations from this new government. Extending from governance to education to the corporate sector, this is my list:

  • How can justice be delivered faster? The numbers of pending cases in lower courts to SC are scary. The main issues are – slow resolution, and cases in lower court routinely reopened in higher courts. Our suggestion is to – have no vacancies for judges, courts open all year long, push for mediated solution rather than court battle, time bound cases (no tareek pe tareek) and low acceptance in higher courts. Digital solutions can speed access and enable common judgements for similar cases. The NCLT driven IBC code has also proven its usefulness. However this needs to be tightened based on the experience so far, to be faster and with higher success rates.
  • Do we have the right education systems today? The problems extend from low penetration and presence of schools, high dropout rates, poor learning and skill building outcomes, overlaps between state and central boards, many languages and high study load for students. Our suggestions are – more and better govt. schools, coordination between central and state boards on content and timetables, free and compulsory (penalty parents punishable) govt. education till 10th, digital tracking of schools, teachers and students, better curriculum of less rote and more experiential, discovery and project based learning, emphasis on sports with good facilities, and zero homework. Competition is always good, so all education should be freed from govt. license shackles. The best universities will naturally thrive.
  • Is the right way Garibi Hatao or Amiri Badhao? Both are important. On the former side, the excellent work on toilets, housing for all, LPG, ration card based subsidies, farmer schemes, cooperatives, good supply chain to agriculture needs to continue. Electricity for all, better quality electricity, lower leakages, pension for 60+ age, unemployment measurement and schemes (MGNREGA) needs to be bolstered. All subsidies and subsidized product distribution needs to go through Aadhar verification to plug leakages. On the latter side, corporates need to be encouraged as they generate employment, good salaries and taxable profits. Real Estate and Textiles need revival. Exports and a good startup environment is important.
  • Need for Infrastructure: This is obvious, and a crying need. While some progress has been made on Roads and Electricity, much more needs to be done here; and in Railways, Airways, Ports, Water supply, Healthcare and Education, Municipal reforms and Town planning, local transportation and Police reforms.
    1. Suggestions – funding is as important here as detailed planning. Pension and Insurance funds should be allowed and enabled to invest in Infra.
    2. Projects have to be reasonably profitable for private sector operators, with lower risks and permit challenges.
    3. Development of 1-2 new metros in every state. The current 6-7 metros are overcrowded and infra is stretched. The next 20-30 cities need to develop systematically to take pressure off these metros. The Smart Cities Mission needs to be accelerated.
  • Public Sector Enterprises: The Govt. should not be in any operational firm that has no national Interests. Firms like SAIL, NTPC, HPCL, BPCL, many parts of Indian Railways, BSNL, MTNL, Coal India, etc. should be freed from the chains of PSU restrictions, allowed to operate freely and generate reasonable returns. The PSUs and govt. ministries have assets worth lakhs of crores that are generating low single digit returns. GoI should monetize firms, assets and lands and sell to investors – foreign, Indian or even their own employees, through IPOs, auctions and management takeovers. And fund Infrastructure, Education and social needs.
  • The role of Regulators: The right way to encourage growth in a sector is to have a Regulatory authority that ensures a level playing field and meet national and business objectives to develop the sector. It has to include a think tank and sector experts. Regulators for every sector should be much more dynamic, open to discussion and forward looking, with minimum regulatory and legal overlaps. They must enable minimum ROI for new sector entrants. The success of SEBI, IRDAI, TRAI, etc. has to be extended to Hospitals, Education, Pharma, automobiles, chemicals, etc. to roll out required standards & compliance, and encourage growth and penetration.
  • Taxes, Interest Rates and more on Corporate Sector: The laundry list of urgent needs is
    1. Corporate taxes need to be lowered. This was a Modi 1.0 promise – lower taxes and fewer tax concessions.
    2. The current interest rates in India are very high in the global context, as well as given the low domestic inflation. Rates need to lowered – through RBI intervention and easing up of foreign borrowing.
    3. Simplification of GST to 2-3 levels. Inclusion of liquor, petro products and cigarettes
    4. SEZ model revival and encouragement of exports
    5. Labor reforms. Firms should be able to hire (and fire) more easily and with lower overheads.
    6. We need to officially and robustly measure & track Unemployment. This is a key economic measure.
    7. Auditors have an important role in prevention of financial crimes. Perhaps a regulator is needed for Statutory Auditors to keep up standards and prevent problems early.
  • Do we need to export more or import less? Both. Many high tech products like auto steels, specialty chemicals, commodities, oil, gold, machinery, chocolates and consumer products are imported for factories and consumers here. Local manufacturing needs to step up to fill these needs. Also exports is still not happening on a good scale. We are running a trade deficit. This has to be filled up by IT & ITES, pharma, automobiles, engineered products, steel, aluminum, petro products, gem & jewellery, tourism, airport /aviation and seaports /shipping.
  • Environmental protection: As the globe gets hotter, the oceans dirtier and forests thinner, it’s sad to see USA dropping environmental concerns and reneging on commitments. In the war on air, water and plastic pollution, India has a secret weapon – low cost of operations. It’s possible to recycle old ships (Alang), electronics /ewaste, newspaper and most dry waste, and generate a wage for workers and a profit for the business. However we need to protect our borders from waste dumping. And the Ministry of Environment, Forest and Climate Change needs to proactively reach out to industry, municipal corporations and volunteers to enable and scale these activities.
  • Thoughts on Ministerial Changes:
    1. In Singapore, the minister appointed for an Industry is often a very respected senior business executive from the sector, who transitions from a CEO role, to developing the sector for the nation. Knowledge of individuals gets institutionalized. This has allowed Singapore to progress very fast, it is now a Developed economy. India must adopt this model as in many ministries leadership requires a lot of industry knowledge.
    2. In India, we saw the Railways and Coal ministries work together innovatively due to a common Minister. Such strong coordination is needed to solve challenges such as Kashmir (Home and Defense), Transportation (Ports, Road, Rail, Air) and Energy (Electricity, Petroleum, Solar, Wind, Coal, Hydro,) etc.

Conclusion

  • Execution, administrative reform and good governance have been key observations in Modi 1.0. National pride, Industrial progress and social capital are coming together well.
  • We need to do even better in this new regime to take Indian GDP to 8-10% growth range and lift standards of 130 crore / 1.3 billion Indians.
  • Also see A Vision for the Indian Economy‘ 

Disclaimer

This document has been prepared by JainMatrix Investments Bangalore (JM), and is meant for use by the recipient only as information and is not for circulation. This document is not to be reported or copied or made available to others without prior permission of JM. It should not be considered or taken as an offer to sell or a solicitation to buy or sell any security. The information contained in this report has been obtained from sources that are considered to be reliable. However, JM has not independently verified the accuracy or completeness of the same. Neither JM nor any of its affiliates, its directors or its employees accepts any responsibility of whatsoever nature for the information, statements and opinion given, made available or expressed herein or for any omission therein. Recipients of this report should be aware that past performance is not necessarily a guide to future performance and value of investments can go down as well. The suitability or otherwise of any investments will depend upon the recipient’s particular circumstances and, in case of doubt, advice should be sought from an Investment Advisor. Punit Jain is a registered Research Analyst under SEBI (Research Analysts) Regulations, 2014. JM has been publishing equity research reports since Nov 2012. Any questions should be directed to the director of JainMatrix Investments at punit.jain@jainmatrix.com.