Aadhar Housing Finance IPO – Constructive

  • Date 08th May; IPO Opens 8-10th May, at ₹ 300-315/share
  • Mid Cap: ₹ 13,500 cr. Mkt cap
  • Sector – NBFC, Affordable Housing
  • Valuations: P/E 18.4, P/B 2.9 times
  • Opinion: Subscribe
  • Summary: Aadhar Housing Finance is a leader in independent affordable housing finance firms. The industry has high growth and AHF is likely to grow in line. Post covid, AHF has enjoyed high growth and improved metrics. It is the largest affordable HFC in India in terms of AUM. The company also has a geographically diversified AUM. The IPO has a fresh issue part, which will strengthen the balance sheet and support loan growth. The firm is professionally run.
  • Risks: 1) micro home loans can be affected by political, social and weather disruptions 2) Blackstone as promoter is an asset manager, and can exit its holdings over the next few years 3) Regulatory risks like RBI norms compliance and policy changes 4) rising interest rates can put pressure on margins 5) Housing is a cyclical industry
  • Opinion: Subscribe to Aadhar Housing Finance IPO.

Here is a note on Aadhar Housing Finance IPO – AHF.

IPO highlights

  • The IPO opens from 8-10th May 2024 in a Price Band of ₹ 300-315 per share
  • It is a Fresh Issue of ₹ 1,000 cr. & OFS ₹ 2,000 cr., total ₹ 3,000 cr., which is 22.3% of share capital post IPO. (OFS – offer for Sale by the promoter of existing holding).
  • Promoter is Blackstone Asset’s fund BCP Topco VII Pte whose 98.7% will fall to 76.5% post-IPO.
  • The main objects of the OFS part of IPO are 1) ₹ 750 cr. towards maintaining higher Tier 1 capital towards lending and 2) Rest for General Corporate purposes.
  • The lot size is 47 shares and Face Value ₹ 10 per share.
  • The IPO share quotas are Institutional: Non-Institutional Investors: Retail of 50:15:35%.
  • The unofficial/ grey market premium of AHF is ₹ 90 /share over IPO price. This is a positive.
  • The IPO allotment is likely to be finalized on 13 May, refunds and crediting of shares will be on 14 May. AHF shares will list on BSE and NSE, on 15 May.

Introduction

  • AHF is a retail-focused affordable housing finance company, serving economically weaker and low-to-middle-income customers, who require small-ticket mortgage loans.
  • Revenue from operations grew from ₹ 1,575 cr. in FY’21 to ₹ 2,043 cr. in FY’23 at a CAGR of 13.89%, PAT CAGR was 26.56% and EBITDA CAGR was 10.44% over last three years.
  • It is the largest affordable HFC in India in terms of AUM.
  • The firm has been operational since Feb 2011, but underwent a transformation when it merged into DHFL Vysya in Nov’17. Subsequently, it was rebranded as AHF Ltd.
  • BCP TOPCO VII PTE. LTD. (a Blackstone Group Company) is the holding company of AHF Ltd. Blackstone is the world’s largest alternative asset manager, with more than $1 trillion in AUM based in New York City.
  • AHF has a total of 3,885 employees and its 100% owned subsidiary has a total of 1,875 employees.
  • The company has solidified its position as the leading housing finance company in India’s low-income housing market (ticket size less than ₹ 15 lakhs), due to good metrics in this fast growing sub-segment.
  • AHF has the most geographically diversified AUM and the highest operating expenditure ratio efficiency. The company has a network of 487 branches including 109 sales offices (Dec’23), with branches spread across 20 states and UTs. During the year, 59% of the total loans disbursed were through in-house channels.
  • No single state accounts for more than 15% of the gross AUM. See Fig 1.1.
  • Management – Rishi Anand (MD/CEO), Rajesh Viswanathan (CFO) and O. P. Bhatt (Chairman). The firm is professionally run, and management is impressive in terms of work experience. See Fig 1.2.

Fig 1.1 – AUM by States / Fig 1.2 – Key leaders

Industry Outlook of Indian Housing Sector

  • Affordable home loans is nothing but a form of microfinance but secured against housing collateral.
  • High Growth: Post Covid in 2020, the housing sector has emerged with high growth. The pandemic established the importance of owned housing, and also drove the Work From Home habits that are widely accepted in the software and tech industry, and have made inroads across the industrial landscape. Its helped by the GoI focus on housing. Following a period of subdued growth in FY20 through FY22, AHFCs experienced good growth during FY23, expanding by 27% year-over-year. This growth trajectory is expected to continue, with CareEdge Ratings forecasting a 29% growth in FY24 and 30% in FY25 for AHFCs.
  • Contribution to Economy: The Indian housing sector is a crucial aspect of the country’s economy, contributing nearly 11% to the GDP and providing employment opportunities to millions of people. However, in the last decade, the sector has faced various challenges such as a shortage of affordable housing, a lack of adequate funding for developers, and limited access to mortgage finance for consumers.
  • Industry data: public sector and private sector banks held the largest market share in housing loans, with a share of 69%. Housing finance companies had 29%, followed by a 2% market share by Affordable Housing Finance companies. Although affordable housing loans constitute around 6% of the overall housing finance industry (Dec’22), the market remains severely underpenetrated. (ICRA, April 2023).
  • Priority Sector Lending Benefits: The RBI has also provided incentives to the housing finance industry by extending priority sector status to housing loans. In addition, pursuant to Section 36(1)(viii) of the Income Tax Act, 1961, up to 20% of profits from eligible business computed under the head “profits and gains of business or profession”, may be carried to a “Special Reserve” and are not subject to income tax.
  • Pradhan Mantri Awas Yojana: The Indian government has initiated a Housing for All scheme by 2022 to promote affordable and low cost housing in the country. To achieve this objective, the government has introduced several measures, including the PMAY for rural and urban regions aims to provide affordable housing for lower-income groups and economically weaker sections of society.
  • Relaxed ECB guidelines: The GoI has also relaxed External Commercial Borrowing (ECB) guidelines to help finance homebuyers. In addition, GoI has announced tax incentives to promote the housing sector. The RERA has been implemented to improve transparency, timely delivery, and organized operations in the sector. GoI also announced a last-mile affordable housing funding package to complete ongoing housing projects in affordable and middle-income categories.
  • Increase in Non-Housing Portfolio Share: Amidst intense competition and the imperative to maintain margins, the share of the non-housing portfolio among AHFCs has risen from 17% as of March 31, 2019, to 26% as of March 31, 2023. This trend is anticipated to persist, with the non-housing portfolio share projected to reach 27% by March 31, 2024. (CareEdge ratings report).
  • Gruh Finance, an affordable housing finance subsidiary of HDFC was acquired by Bandhan Bank in October 2019. It used to enjoy excellent valuations, and can be remembered as an excellent industry case study.
  • NBFC Share Steady: NBFCs have grown at 16-18% overall, see Fig 2.1.

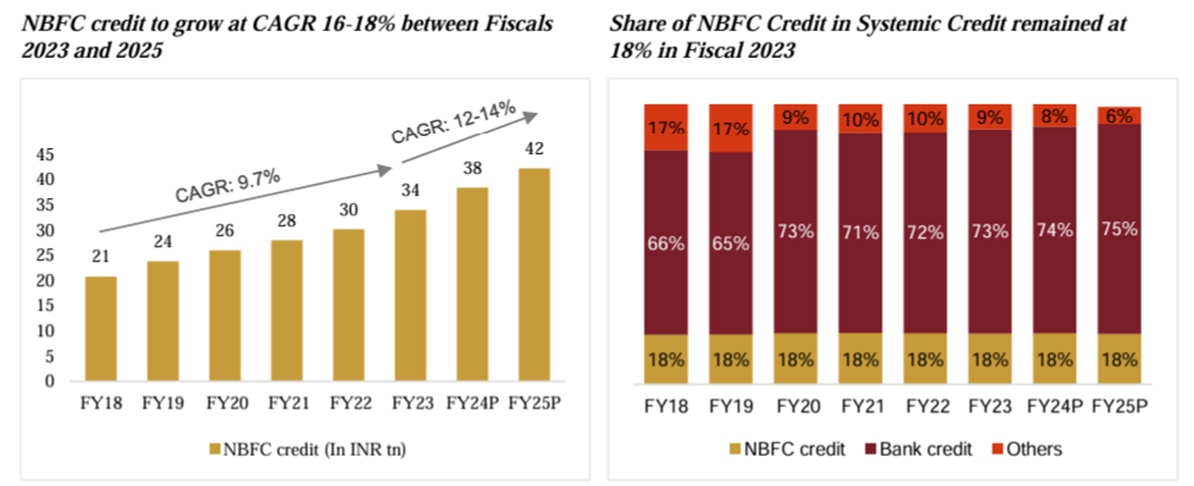
Fig 2.1 NBFC Industry

Aadhar Housing – Financials

  • AHF Revenue, EBITDA & PAT grew by 13.89%, 10.44% and 26.56 % resp, see Fig 3.1.
  • The chart indicates high growth in the last three years from AHF. Margins too are improving.
  • EBITDA Margin is for 3 years ranges between 75% to 80% and PAT margin around 21%-27% for 3 years.
  • The EPS for the company has increased from 8.62 in FY21 to 13.80 in FY23.
  • Gross NPAs and Net NPAs are – 1.4% and 1.0 % (of AUM) in FY23.

Loan services offered are-

  • Home Loan for Salaried Employees, Self-Employed
  • Loan for Purchase of Non-Residential Property, Loan for Plot Purchase & Construction, Composite Loan
  • Balance Transfer and Top-Up  
  • Home Construction Loan, Loan for Construction of Non-Residential Property, Home Improvement Loan, Home Extension Loan, Loan Against Residential and Commercial Property (LAP)
  • Aadhar Gram Unnati

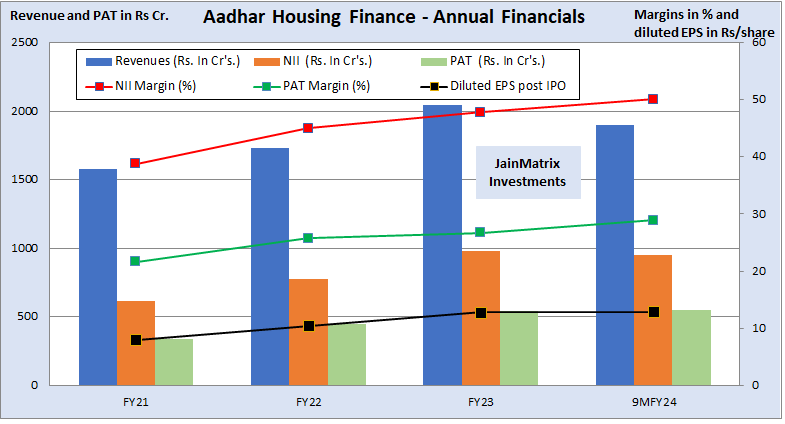
Fig 3.1 – Financials

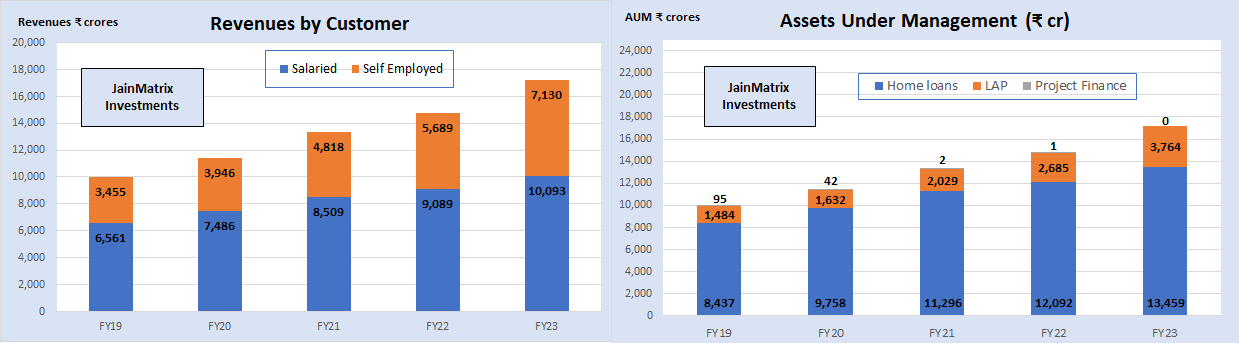
Fig 3.2 – Product-wise Revenue, Fig 3.3 Assets under Management

Fig. 3.4 – Shareholding pattern pre and post IPO

  • The Fig 3.2 shows Customer Wise Revenue; and Fig 3.3 Assets under Management. As of Dec’23, salaried customers accounted for 57.2% and self-employed for 42.8% of Gross AUM, resp. and the company had 255,683 live accounts (including assigned and co-lent loans).
  • We can see that Blackstone which was the dominant shareholder is selling some stake in the Offer for Sale, and taking the firm public through the IPO process. See Fig 3.4 Shareholding pattern.
  • For Blackstone / Topco, the average cost of acquisition per Equity Share in AHF was ₹ 80.54 (RHP). This indicates a 3.9X gain for promoter in the OFS part of IPO.

News, Updates and Strategies

  • IPO resurgence: Indian IPO market has been buoyant over 2-3 years, and most mid/large offerings have been successful. We now worry about excessive valuations and demand in IPO offerings.
  • In Nov 2023, AHF announced its AUM had crossed the $2 billion (₹16,300 cr.) milestone.
  • 07th May – AHF has raised ₹898 cr. from anchor investors a day ahead of the IPO, to 61 anchor investors at the upper price band. Morgan Stanley Asia, Amundi Funds, Neuberger Berman Emerging Markets Equity Fund, Theleme India Master Fund, SBI Life Insurance, ICICI Prudential Life Insurance, HDFC MF, ICICI Prudential MF, Axis MF and Quant MF are among the anchor investors.
  • Blackstone-backed AHF decided to reduce the size of its initial public offer to ₹ 3,000 crore from the originally planned ₹ 5,000 cr. (Source- April, Money Control)
  • This week, primary market is abuzz with anticipation as 3 prominent firms, AHF, Indegene (₹ 1,800) and TBO Tek (₹ 1,500) will launch IPOs to raise nearly ₹ 6,300 cr. (Source- May, Republic World)
  • Mar 2023 – Yes Bank and AHF ink co-lending partnership, in accordance with the co-lending framework of the RBI that enables banks and non-banking companies to jointly bring forth financial solutions that cater to the requirements of the unserved and underserved sections of the society.
  • June 2022 – AHF awarded an IT deal to TCS for an end-to-end business process transformation project, which will use the integrated and collaborative blockchain-based cloud platform.
  • The IPO is for selling 22.3% of the stake of AHF. However a SEBI mandate is that minimum 25% of the listed company should be available to public and institutions in a few years after IPO. Thus we feel that AHF may have a QIP or Follow-on Public Offer (FPO) in a year or two.

Benchmarking

Fig 4.1 – Benchmarking

In a benchmarking exercise we compare AHF to industry peers, to understand it better. See Fig 4.1.

  • Positives: AHF has achieved robust sales growth, outperforming the industry average of 6.08%. While AHF profit growth of 10.4% is respectable, it falls slightly below the industry average of 14.21%.
  • AHF maintains a lower D/E ratio (3.10x) compared to the industry average (4.14x), indicating lower reliance on debt financing and better financial stability. This is positive.
  • AHF demonstrates a strong net profit margin of 26.7%, exceeding the industry average of 21%, indicating efficient cost management and operational efficiency.
  • On Returns parameters of RoE and RoCE, AHF is excellent, while not leading the peers. A positive.
  • Negatives: In terms of Valuation, PE of AHF is on the high side, so it’s expensive. AHF’s price-to-book value ratio of 2.93x, a premium over the industry average of 2.05x. This is also true for EV/EBITDA.
  • EBITDA margin of 75.19% is lower than the industry average of 81.42%, suggesting lower operating profitability.

AHF hasn’t stood out as either very good or bad on the benchmarking section. It appears to be stable and improving steadily on current performance. The high valuations can be interpreted as the cost of quality.

SWOT Analysis

Fig 4.2 – SWOT

Risks

  • Similar to microfinance, micro-home loans can be affected by political, social and weather disruptions, which can affect customers’ livelihoods and their ability to repay loans.
  • Blackstone is the promoter and asset manager and may be interested in exiting its holdings in AHF over the next few years. If this happens, it may be an unstable promoter, and there may be pressure on share prices on every exit, or until the firm is taken over by a stable new promoter.
  • Regulatory risks include RBI intervention, changes in Priority Sector policy, KYC issues, etc.
  • Window dressing: Many companies present improved financials pre-IPO, and these unwind after listing. We are unable to ascertain if AHF has done this, but it remains a risk.  
  • AHF is a party to certain legal proceedings and any adverse outcome can be an issue.
  • An increase in the NPA will adversely affect the company and its financials. NPA resolution can be long drawn out and involve litigation and friction.
  • AHF is exposed to adverse fluctuations in interest rates and credit spreads. Inflation too can affect demand for loans from this firm.

Overall Opinion and Recommendation

  • The Real Estate & housing industry is now in a multi-year upcycle, following a downcycle from 2010-20.
  • Microfinance has been a high-performing sector but affected by political & social disruptions.
  • AHF has been sharply focused on rural Housing finance and is structured to grow in this segment.
  • AHF has a high expertise in the low-income housing segment which makes it the largest player in the low-income housing market in India. It enjoys a Pan India presence, so extensive branch networks, geographical penetration, and good sales channels contribute significantly to loan sourcing and servicing. The company posted steady growth in its top and bottom lines for the reported periods. AHF is well placed to leverage its dominance to tap the growth potential of the industry.
  • The future growth of the affordable housing finance market looks positive aided by government policies, an increased supply of affordable homes, rising demand in tier 2/3/4 cities, and fair home loan interest rates.
  • Key Risks – 1) micro home loans can be affected by political, social and weather disruptions 2) Blackstone as promoter is an asset manager, and may exit its holdings over the next few years 3) Regulatory risks like RBI norms compliance and policy changes 4) rising interest rates can put pressure on margins 5) Housing is a cyclical industry
  • Opinion – Subscribe to Aadhar Housing Finance IPO

Disclaimer

Punit Jain discloses that he has no positions in Aadhar Housing Finance or Blackrock Asset as on date of this report. But inline with this report, he intends to subscribe to the Aadhar Housing Finance in the IPO.

This document has been prepared by JainMatrix Investments Bangalore (JMI), and is meant for use by the recipient only as information and is not for circulation. This document is not to be reported or copied or made available to others without prior permission of JMI. It should not be considered or taken as an offer to sell or a solicitation to buy or sell any security. The information contained in this report has been obtained from sources that are considered to be reliable. However, JMI has not independently verified the accuracy or completeness of the same. Neither JMI nor any of its affiliates, its directors or its employees accepts any responsibility of whatsoever nature for the information, statements and opinion given, made available or expressed herein or for any omission therein. Recipients of this report should be aware that past performance is not necessarily a guide to future performance and value of investments can go down as well. The suitability or otherwise of any investments will depend upon the recipient’s particular circumstances and, in case of doubt, advice should be sought from a RIA Registered Investment Advisor. Investment in securities market are subject to market risks. Read all the related documents carefully before investing.

Punit Jain is a registered Research Analyst under SEBI (Research Analysts) Regulations, 2014. Registration granted by SEBI, and certification from NISM in no way guarantee performance of the RA or provide any assurance of returns to investors. JMI has been publishing equity research reports since Nov 2012. Any questions should be directed to the director of JainMatrix Investments at punit.jain@jainmatrix.com  Name of the RA as registered with SEBI – Punit Jain, SEBI Registration No. INH200002747. Logo/brand name –

NBFC Sector – Can a generational leap of Technology help dominate the Market?

Summary:

This report was published on 25nd Mar 2024, so all prices and news are dated accordingly. This is a research note on 3 leading Indian NBFC firms, Bajaj Finance, Jio Financial Services and L&T Finance Holdings. We profile the firms in terms of their structure, business segments, share price history and key financial parameters. Next we capture their key Qualitative Aspects and do a SWOT analysis of them, to help investors understand these firms better. This report is for educational purposes. We do not set any price targets nor make any company-specific recommendations.

Introduction

In this note, we examine three large players from the Indian Non-Banking Financial (NBFC) Industry.

Brief Profiles – Bajaj Finance Ltd.                      CMP ₹ 6,760                                             

  • Bajaj Finance (BFL) was started in 1987 as a vehicle financing firm and is now is one of the largest and most diversified loan NBFCs in India. BFL is mainly engaged in the business of lending, and has a portfolio across retail, SME and commercial customers with a presence in urban and rural India. It also accepts public and corporate deposits. BFL has two wholly owned subsidiaries, Bajaj Housing Finance and Bajaj Financial Securities, through which it offers home loans and brokerage services & lending.
  • Bajaj Finserv Ltd. is the holding company for the financial services businesses of the Bajaj group. It holds 51.42% stake in BFL. Bajaj Finserv offers general & life insurance, and advisory and investment planning services through subsidiaries Bajaj Allianz General Insurance & Bajaj Allianz Life Insurance. 
  • Leadership in BFL is Sanjiv Bajaj (Chairman), Rajeev Jain (MD&CEO) and Sandeep Jain (CFO).

Jio Financial Services                                             CMP ₹ 345                                                 

  • Jio Financial Services (JFS) started as Reliance Strategic Investments in 1999, but JFS was incorporated in Jul’23. It is a systemically important Non-Deposit taking NBFC (NBFC-ND-SI) registered with RBI. It is a holding company and operates through its consumer-facing subsidiaries namely Jio Finance Ltd., Jio Insurance Broking, Jio Payment Solutions and a JV, Jio Payments Bank. For its asset management business, JFS has entered into a JV with BlackRock with an initial investment of US$ 150 m.
  • JFS was demerged from Reliance Industries and listed in July’23. Shares were awarded in a ratio 1:1, so for every share held of Reliance, shareholders received one share of JFS. 
  • Management – KV Kamath (Chairman), Hitesh Kumar Sethia (MD&CEO), and Abhishek Pathak (CFO).

L&T Finance Holdings                                           CMP ₹ 155                                             

  • L&T Finance Holdings (LTF) offers a diverse range of financial products and services such as Farm equipment finance, Two-wheeler finance, Micro Loans, Consumer loans, home loans, Loans against property (LAP), Real estate finance, infra finance, Infra Debt Fund and other services.
  • It is registered with RBI as a Systemically Important Non-Deposit Accepting Core Investment Co (NBFC-CIC). LTF has an operational presence across India and is headquartered in Mumbai, Mah.
  • LTF is now in the process of changing its name from L&T Finance Holdings to L&T Finance.
  • The promoter is L&T Ltd. LTF successfully completed the merger of subsidiaries, L&T Finance, L&T Infra Credit and L&T Mutual Fund Trustee with itself. This will simplify operations and save costs.
  • Management – Sudipta Roy (MD&CEO), Sachinn Joshi (CFO) and S. N. Subrahmanyan (Chairperson).

This report can be downloaded as a PDF file using link below.

Disclaimer This document has been prepared by JainMatrix Investments Bangalore (JMI), and is meant for use by the recipient only as information and is not for circulation. This document is not to be reported or copied or made available to others without prior permission of JMI. It should not be considered or taken as an offer to sell or a solicitation to buy or sell any security. The information contained in this report has been obtained from sources that are considered to be reliable. However, JMI has not independently verified the accuracy or completeness of the same. Punit Jain discloses that he is an investor in Bajaj Finance Ltd (<1%) since April 2003. He has no positions in L&T Finance or Jio Financial Services, but owns shares in group companies Larsen & Toubro, L&T Technology Services and LTIM; and Reliance Industries (all <1%) as on date of this report. Neither JMI nor any of its affiliates, its directors or its employees accepts any responsibility of whatsoever nature for the information, statements and opinion given, made available or expressed herein or for any omission therein. Recipients of this report should be aware that past performance is not necessarily a guide to future performance and value of investments can go down as well. The suitability or otherwise of any investments will depend upon the recipient’s particular circumstances and, in case of doubt, advice should be sought from a RIA Registered Investment Advisor. Investment in securities market are subject to market risks. Read all the related documents carefully before investing. Punit Jain is a registered Research Analyst under SEBI (Research Analysts) Regulations, 2014. Registration granted by SEBI, and certification from NISM in no way guarantee performance of the RA or provide any assurance of returns to investors. JMI has been publishing equity research reports since Nov 2012. Any questions should be directed to the director of JainMatrix Investments at punit.jain@jainmatrix.com Name of the RA as registered with SEBI – Punit Jain, SEBI Registration No. INH200002747. Logo/brand name –

Large Caps, Mid Caps and Small Caps?

Did you know that the definition of a large-cap, mid-cap and small-cap in India changes every 6 months? This applies particularly for Indian Mutual Funds, so that as of now –

  1. Large-cap companies are those ranked from 1-100 in order of market capitalisation
    • Per the recent review, the large-cap threshold is now ₹ 67,000 cr., up from ₹ 49,700 cr. in Jun’23.
  2. Mid-cap companies are those ranked from 101 – 250 by market cap
    • The range for mid-caps is now ₹ 22,000 – 67,000 cr. The lower limit rose from ₹ 17,400 cr. earlier
  3. And small-caps are all firms with a market cap below 22,000 cr.

This is quite relevant for Mutual Funds, where many define their strategy as Large Caps or Small caps. This definition, and periodic reviews, ensures that MFs stick to their strategy.
For direct investors too, we can loosely follow this definition.

This also means that firms doing well by market cap may transition up from one group to another. Several firms may also transition down, given how sharply the limits have increased. This transition may mean that MFs may buy or exit from them, in order to retain their MF strategy.

JainMatrix Investments is a SEBI registered Research Analyst firm. We publish research recommendations grouped by 1) Large Cap, 2) Mid & Small Cap and 3) Satellite stocks, which is a mixed group. With these investors can invest directly in recommended equities for their Wealth building journey.

Source – Article – AMFI classification: Jio Financial makes it to largecap list, Tata Tech, IREDA midcaps https://www.moneycontrol.com/news/business/markets/amfi-classification-jio-financial-makes-it-to-largecap-list-tata-tech-ireda-midcaps-11996161.html

DISCLAIMER

This document has been prepared by JainMatrix Investments Bangalore (JM), and is meant for use by the recipient only as information and is not for circulation. This document is not to be reported or copied or made available to others without prior permission of JM. It should not be considered or taken as an offer to sell or a solicitation to buy or sell any security. The information contained in this report has been obtained from sources that are considered to be reliable. However, JM has not independently verified the accuracy or completeness of the same. Neither JM nor any of its affiliates, its directors or its employees accepts any responsibility of whatsoever nature for the information, statements and opinion given, made available or expressed herein or for any omission therein. Recipients of this report should be aware that past performance is not necessarily a guide to future performance and value of investments can go down as well. The suitability or otherwise of any investments will depend upon the recipient’s particular circumstances and, in case of doubt, advice should be sought from a RIA Registered Investment Advisor. Investment in securities market are subject to market risks. Read all the related documents carefully before investing. Punit Jain is a registered Research Analyst under SEBI (Research Analysts) Regulations, 2014. Registration granted by SEBI, and certification from NISM in no way guarantee performance of the RA or provide any assurance of returns to investors. JM has been publishing equity research reports since Nov 2012. Any questions should be directed to the director of JainMatrix Investments at punit.jain@jainmatrix.com. Name of the RA as registered with SEBI – Punit Jain, SEBI Registration No. INH200002747. Logo/brand name –

RP Tech – The ICT Distribution Leader – IPO

  • Also known as Rashi Peripherals Ltd.
  • 07th Feb, IPO Opens 7-9th Feb
  • Pricing range – ₹ 295-311/share
  • Valuations: P/E 16.6, EV/EBITDA – 2.07, P/B 2.6 times
  • Small Cap: ₹ 2,000 cr. Mkt cap
  • Sector – Technology

Summary

  • RP Tech distributes global technology brands in India. They specialize in ICT products and have a 9.5% market share in India sales. Part of the ICT global supply chain. The organization and structure set up looks good to handle the growth. At current pricing range, RP Tech looks fairly valued. We expect margin expansion after reduction in debt levels even as it grows rapidly in revenues. Once this happens, valuations will look reasonable.
  • Risks: 1) Thin operating margins, high working capital and high debt 3) Supplier Concentration – top eight brands accounted for 82% of revenue 4) Indirect Tax contingent liabilities.
  • Opinion: Medium rated. Aggressive Investors can SUBSCRIBE for short-term gains.

Here is a note on RP Tech IPO.

IPO highlights

  • The IPO opens from 7-9th Feb 2024 in a Price Band of ₹ 295-311 per share
  • It is a Fresh Issue of ₹ 600 cr. of 6.58 cr. shares, which is 36.6 % of the equity share capital.
  • The promoters are Choudhary & Pansari families that own 89.65% which will fall to 63.41% post-IPO.
  • The main objects of the IPO are 1) Repayment of debts of ₹ 326 cr. and 2) Funding working capital requirement ₹ 220 cr. 3) The remaining 50+ cr. is for general corporate purposes.
  • The lot size is 48 shares and Face Value ₹ 5 per share
  • The IPO share quotas are QIBs: Non-Institutional Investors: Retail is 50:15:35%.
  • The unofficial/ grey market premium of RP Tech is ₹ 70 /share over IPO price. This is a positive.
  • The IPO allotment is likely to be finalized on 12 Feb, refunds will be on 13 Feb, and also crediting of shares to eligible allottees. RP Tech shares will list on BSE and NSE, on 14 Feb.

Introduction

  • RP Tech distributes global technology brands in India. They specialize in products related to Information and Communication Technology (ICT). It has value-added services such as pre-sales, technical support, marketing services, credit solutions and warranty management services.
  • Revenue from operations grew at a CAGR of 26.32% from ₹ 5,930 cr. in FY’21 to ₹ 9,468 cr. in FY’23, PAT generated CAGR of -4.80% and EBITDA with CAGR of 11.38% over last three years.
  • RP Tech is the national distributor for 53 global technology brands and has 50 branches, and 63 warehouses across India, with 8,657 distributors across 680 locations in 28 States and UTs.
  • These 50 branches operated as sales & service centres and warehouses, and distributed and sold 10,508 SKUs and 34.38 million units in FY23. Exports are just 2.6% of the business, rest is domestic.
  • It had 1,433 employees, including 549 in Sales & Marketing and 64 in the technical support team.
  • The company has two business verticals –
  • Personal computing, Enterprise and Cloud Solutions (PES): This includes personal computing devices, enterprise solutions, embedded designs/products and cloud computing.
  • Lifestyle and IT essentials (LIT): This includes products such as (i) components such as graphics cards, central processing units (CPUs) and motherboards; (ii) storage and memory devices; (iii) lifestyle peripherals and accessories such as keyboards, mice, webcams, monitors, wearables, casting devices, fitness trackers and gaming accessories; (iv) power devices such as UPS and inverters; and (v) networking and mobility devices.
  • The Fig 1.1 below shows the Revenue By Vertical; and Fig 1.2 the Market Share by Product

Fig 1.1 – Revenues by Vertical and Fig 1.2 Market Shares

  • The company’s clients include ASUS Global., Dell International, HP India, Lenovo India, Logitech Asia Pacific, NVIDIA Corp, Intel Americas, Western Digital (UK), Schneider Electric IT Business, Eaton Power Quality Pvt. Ltd., ECS Industrial Computer Co. Ltd., Belkin Asia Pacific, TPV Technology India, LG Electronics India, and Toshiba Electronic Components, Taiwan Corporation, among others.
  • RP Tech has a good relationship with marquee customers for a very long time.
  • RP Tech differentiate itself by offering end-to-end services such as pre-sale activities, solutions design, technical support, marketing services, credit solutions and warranty management services.

Fig 1.3 Locations

Fig 1.4 – Distribution and 1.5 – Shareholding pattern

  • RP Tech distributes products through several channels or networks – General Trade (81%), e-commerce 13% and Modern trade 6%. Above Fig 1.4 shows the distribution network and channels.
  • See shareholding pattern pre-IPO in Fig 1.5.
  • Below Fig 1.6 – Strong Customer Relationships in years with prominent brands.

Fig 1.6 Clients

  • Fig 1.7 – Key leaders:
  • (L- R) Himanshu Kumar Shah CFO, Krishna Kumar Choudhary, Chairman, Kapal Pansari MD, Sureshkumar Pansari, Vice-Chairman and Rajesh Goenka, CEO.

News, Updates and Strategies

  • In a pre-IPO placement, ace investor Madhusudan Kela’s wife Madhuri Kela invested ₹ 50 cr. and Volrado Venture Partners Fund-III-BETA, a venture capital fund, invested ₹ 100 cr. and were allotted 48.23 lakh equity shares at an issue price of ₹ 311 apiece.
  • A day before the IPO, the firm made allotments to Anchor investors. It allotted 57.88 lakh shares to 18 funds at ₹ 311 per share, at the upper limit. The anchor investors who participated in the bidding process include prominent foreign and domestic institutions such as White Oak Capital, Ashoka India, ICICI Prudential MF, Volrado Venture Partners Fund, and Bajaj Alliance Life Insurance Company. Other notable participants in the bidding round were Aditya Birla Sun Life Insurance Company, SBI General Insurance Company, Singularity Growth Opportunity Fund, and Authum Investment and Infra.
  • Out of the total allocation of 57.88 lakh equity shares, domestic mutual funds were allotted 19.61 lakh equity shares through a total of 8 schemes, amounting to ₹ 61 crore.

Industry Outlook of ICT in India

  • India has a young population, and is a developing nation, so it has a faster growing market than developed nations such as USA, UK, and Canada in terms of retail consumption. They are better exposed to media and technology, which presents an opportunity for domestic consumption in the form of branded products and organized retail.
  • Govt. of India has an initiative of Make in India and is also promoting Electronic Mfg. Clusters throughout the country to provide world-class infrastructure and facilities.
  • The GoI is aiming to increase the production of electronic items to USD 300 billion by Fiscal 2026. The domestic consumption of products is expected to increase from USD 75 billion in Fiscal 2022 to USD 150- 180 billion by Fiscal 2026.
  • India’s ICT Industry size is about 1 lakh cr. now and is expected to reach ₹ 1,08,700 cr. by 2025.

Fig 2 – ICT Industry Size

  • Govt. of India’s Production-linked Incentive (“PLI”) scheme provides Incentives to boost domestic mfg. and attract large investments in IT Hardware value chain with target segments of laptops, tablets, all-in-one PCs, and servers, and boost the export market for the same. In electronic/technology products and telecom and network products, the approved financial outlay over the five years period is ₹ 12,200 cr.
  • We estimate that RP Tech has a Market Share of 9.5% of the Indian ICT distribution market.

Financials of RP Tech

  • RP Tech revenues, EBITDA and PAT over the years are in Fig 3a. Revenue, EBITDA & PAT grew by 26.36%, 11.38% and (4.80) % respectively.
  • Increase in interest costs is hurting their PAT.
  • In below Fig 3b Cash Flow we can see that the Free Cash Flow FCF is negative. The firm has made many investments in inventories, assets and payables that have made FCF negative.
  • EBITDA Margin is constant over 2.8-3.5% and PAT around 1.30-2.29% variation due to externalities. This is average industry margins.
  • Considering ₹ 326 cr. will used from IPO proceeds for repayment of Debt, the firm’s debt to equity will reduce from current pre-IPO 1.82 to 1.30 post IPO.

Fig 3a – Financials

Fig 3b Cash Flow

Benchmarking

We benchmark RP Tech against listed ICT distribution and mfg. firms, See Fig 3c below.

Fig 3c – Benchmarking

  • P/E currently at 15.74 looks priced overpriced. Its EV/EBITDA is 2.07, which looks reasonable. Thus the valuations of RP Tech looks mixed.
  • The 3 year Sales and Profits growth look low. There was a massive sales growth for RP Tech in FY21 and FY22 during covid, and that is now normalizing.
  • D/E ratio is high, but post IPO, debt should fall as a main object of IPO is to reduce debt.
  • Margins are on par with competitors.
  • Return on Equity and RoCE are fair and in line with industry.
  • Putting this together, we sense that RP Tech will return to steady industry plus growth now, and improve its financial parameters in the next 1-2 years.
  • The strong business relationships, wide distribution network and digital growth of the economy will reflect well on RP Tech.

Positives for RP Tech

  • Strong technical expertise of firm across a range of ICT products for sales, service and support.
  • Long term relationship with marquee global tech clients to ensure availability of products.
  • Reputation as Leading and fastest growing Indian distribution partner for ICT products.
  • Repeat orders constitute 70-80% of business, this showcases the stickiness and moat of RP Tech.
  • Diversified portfolio offering with 10,000+ SKU’s and value-added solutions.
  • Pan-India and multi-channel distribution footprint backed by dedicated in-house infrastructure.

Risks and Negatives

  • High dependency on various vendors, who are global technology brands, revenues generated from distribution of products mfg. by top eight global technology brands amounted to 82% of revenue from operations. Any delay or failure on part of such global technology brands to supply products may materially and adversely affect business, profitability and reputation.
  • Good relationships with Channel Partners and enterprise customers is important as if any of these parties change the terms of their arrangements business could be materially and adversely affected.
  • RP Tech is operating on thin margins, an increase in debt or interest rates can affect the financials. There has been an increase in Debt to equity from 1.23 in FY21 to 1.82 in six month ended Sep’23.
  • Reduction in EBITDA margin from 3.63% in FY21 to 2.83% in FY 23 was due to higher interest rates.
  • Continued negative cash flows can affect the financials of the business. RP Tech will certainly have to stabilize their working capital needs while handling growth.
  • Risk of liability claims. Failure to maintain quality of customer service and deal with customer complaints could materially and adversely affect business and operating results.
  • RP Tech has Contingent Liabilities of ₹ 592 cr. (RHP), of which for Indirect Tax is ₹ 281 cr.
  • A Subsidiary ZNet Technologies Pvt. Ltd., has incurred losses in the last three Fiscals. There is no visibility on profitability.

Overall Opinion and Recommendation

  • India has a large and growing software and Tech industry, and it is an exports leader. Many global firms are setting up Global Competence Centers here. Within India too, technology is permeating the population through devices and internet, at work and leisure.
  • RP Tech is an important player in the ICT industry. It has a strong grip and 9.5% market share in sales. We expect growth at RP Tech to be strong. RP Tech have strengths of stickiness of customer with 70-80% of business from repeat orders and strong relationship with brands. Company management and board looks solid with rich experience in this field.
  • RP Tech is well set and a solid growth prospect in future.
  • However the firm is just settling down from 2-3 years of an unusual post covid business situation. Financials are in a recovery process and may take a few quarters to stabilize. This IPO helps to rest some of the debt. The recovery process needs to continue by controlling the working capital.
  • We expect reduction in debt to equity after IPO even as it grows rapidly in revenue and offerings. Once this happens, RP Tech valuations will rise and this IPO entry price will look reasonable.
  • Risks: 1) Thin operating margins, high working capital and high debt 3) Supplier Concentration – top eight brands accounted for 82% of revenue 4) Indirect Tax contingent liabilities.
  • Opinion: Medium rated. Aggressive Investors can SUBSCRIBE for short-term gains.

Disclaimer

This document has been prepared by JainMatrix Investments Bangalore (JM), and is meant for use by the recipient only as information and is not for circulation. This document is not to be reported or copied or made available to others without prior permission of JM. It should not be considered or taken as an offer to sell or a solicitation to buy or sell any security. The information contained in this report has been obtained from sources that are considered to be reliable. However, JM has not independently verified the accuracy or completeness of the same. JM has no stake ownership or financial interests in RP tech or any group company. Punit Jain intends to apply for this IPO. Neither JM nor any of its affiliates, its directors or its employees accepts any responsibility of whatsoever nature for the information, statements and opinion given, made available or expressed herein or for any omission therein. Recipients of this report should be aware that past performance is not necessarily a guide to future performance and value of investments can go down as well. The suitability or otherwise of any investments will depend upon the recipient’s particular circumstances and, in case of doubt, advice should be sought from a RIA Registered Investment Advisor. Investment in securities market are subject to market risks. Read all the related documents carefully before investing. Punit Jain is a registered Research Analyst under SEBI (Research Analysts) Regulations, 2014. Registration granted by SEBI, and certification from NISM in no way guarantee performance of the RA or provide any assurance of returns to investors. JM has been publishing equity research reports since Nov 2012. Any questions should be directed to the director of JainMatrix Investments at punit.jain@jainmatrix.com. Name of the RA as registered with SEBI – Punit Jain, SEBI Registration No. INH200002747. Logo/brand name –

TCS – Share Buyback – Nov 2023

  • Date 21st Nov 2023
  • CMP: ₹ 3,530/share
  • Large Cap with ₹ 13,00,000 cr. Mkt cap
  • Buy Back price: ₹ 4,150/share; Record Date: 25th Nov

Introduction

TCS is a well-known Large Cap stock. TCS has announced a Buyback offer, here is a note on this. The offer is attractive.

About the Offer

  • TCS approved a buyback offer at ₹ 4,150 /share for the repurchase of 4 cr. shares comprising 1.1% of the share capital for up to ₹ 17,000 cr. It is at a premium of 18% to its current price of ₹ 3,530. The record date is 25th Nov.
  • Objective: The firm has offered to reward and return cash to shareholders. Post-buyback, the equity share capital will reduce, and so the ROE (Return on Equity) of TCS will rise.
  • This is a shareholder-friendly activity. The firm has a healthy balance sheet already, and so uses the fresh cash generated from the business, to buy back shares, as it is a better use of these funds. IT services is a high cash-generating business that has a low requirement of capex or fresh investments.
  • It’s the 4th buyback in 5 years.
  • SEBI has mandated TCS to reserve 15% of the buyback amount for Retail (small shareholders with holdings under  ₹ 200,000 of shares). Current shareholding pattern indicates TCS has 5% Public shareholders, so Retail may have this additional benefit in this buyback.
  • TCS is well-valued and is trading at a PE multiple of 29 times today, above the historical average of 25 times. Its Q2FY24 result was good. The share has however underperformed the Nifty since early 2022.

Opinion

  • If you do not hold TCS shares, you can Buy 48 shares of TCS now as retail, and Offer your shares through the buyback to TCS, and sell the rest soon after for short-term gains. Or sell the shares after 1 year for Long Term Capital gains.
  • There is a good probability that TCS share could rise to the buyback price ₹ 4,150 in a few months.
  • If you already hold TCS shares, then two options:
    • If you hold 48 or fewer shares (i.e. you are a Retail investor in TCS), offer your shares in the buyback, and purchase from the open market after record date 25th Nov to take advantage of the discount.
    • If you hold more than 48 shares, take part in the buyback to the full extent, and purchase shares from the market now to take advantage of the 18% discount, and average down on your holding cost.  
  • Investors can take advantage of tax benefits, as the income generated from this buyback of shares is tax-exempt.

Process of buyback

  • Investors holding Shares in Demat Form can tender shares through their Stock Broker. If you have online access, there will be a BUYBACK page option for TCS, once the offer opens. TCS will inform shareholders about this soon.
  • For more details, see FAQ from TCS on buyback attached.

Disclaimers and Disclosures

Punit Jain discloses that he is a long term investor (less than 1%) in TCS since 2012. Punit Jain was an employee of TCS from 1995 to 2001. He will also take part in this BUYBACK. Other than these, Punit Jain and JainMatrix Investments Bangalore (JMI) and its promoters/ employees have no direct or financial interest in TCS, and no known material conflict of interest as on date of publication of this report. This document has been prepared by JMI, and is meant for use by the recipient only as information and is not for circulation. This document is not to be reported or copied or made available to others without prior permission of JMI. It should not be considered or taken as an offer to sell or a solicitation to buy or sell any security. The information contained in this report has been obtained from sources that are considered to be reliable. However, JMI has not independently verified the accuracy or completeness of the same. Neither JMI nor any of its affiliates, its directors or its employees accepts any responsibility of whatsoever nature for the information, statements and opinion given, made available or expressed herein or for any omission therein. Recipients of this report should be aware that past performance is not necessarily a guide to future performance and value of investments can go down as well. The suitability or otherwise of any investments will depend upon the recipient’s particular circumstances and, in case of doubt, advice should be sought from a RIA Registered Investment Advisor. Investment in securities market are subject to market risks. Read all the related documents carefully before investing. Punit Jain is a registered Research Analyst under SEBI (Research Analysts) Regulations, 2014. Registration granted by SEBI, and certification from NISM in no way guarantee performance of the RA or provide any assurance of returns to investors. JMI has been publishing equity research reports since Nov 2012. Any questions should be directed to the director of JainMatrix Investments at punit.jain@jainmatrix.com. Name of the RA as registered with SEBI – Punit Jain, SEBI Registration No. INH200002747.

Who and what is a long-term investor?

A long-term Equity investor is one who
– is willing to wait even 10 years for his investment to achieve satisfactory returns
– is much greedier (I prefer the word Ambitious) than a trader, he wants a 5-20 times return from an investment compared to a 5-20% gain by a trader or other investors. Note – this does not always come through, but when it does, its awesome.
– is able to stay unaffected by notional loss situations, of 30-40%, many times over this journey. He may even use these falls to accumulate more.
– has a very patient and positive mindset. Time is on his side. He is a business owner rather than a trader. He does few transactions, but these are big in value.
– yet he is decisive when required, and has to separate the wheat from the chaff, when he sees it
– has no regrets over past decisions. He has to book real losses many times. He also can make mistakes of smaller allocation. But the future is always very hazy, and the past, crystal clear.
– but he learns continuously. Every decision he makes has to be better than the ones made before. His insights can come from many sources. Mistakes should not be repeated. Only learned from.

This is my mindset as the independent Research Analyst at JainMatrix Investments.

Of course, some of these are difficult to really do, not just for an individual investor, but also for a professional. Join us at JainMatrix for an exciting and profitable journey if you wish to be a long-term equity investor.

PRICING AND PAYMENT OPTIONS

DISCLAIMER

JainMatrix Investments based in Bangalore (hereinafter referred as ‘JMI’) is an independent equity research firm started by Punit Jain. Content in this website should not be considered or taken as an offer to sell or a solicitation to buy or sell any security. The information contained has been obtained from sources that are considered to be reliable. However, JMI has not independently verified the accuracy or completeness of the same. Neither JMI nor any of its affiliates, its directors, or its employees accepts any responsibility of whatsoever nature for the information, statements and opinion given, made available, or expressed herein or for any omission therein. Recipients of this report should be aware that past performance is not necessarily a guide to future performance and the value of investments can go down as well. The suitability or otherwise of any investments will depend upon the recipient’s particular circumstances and, in case of doubt, advice should be sought from an Investment Advisor. Investments in securities market are subject to market risks. Read all the related documents carefully before investing. The suitability or otherwise of any investments will depend upon the recipient’s particular circumstances and, in case of doubt, advice should be sought from a certified Investment Adviser. JM has been an equity investment adviser commercially since Nov 2012. Punit Jain is a SEBI-certified and registered Research Analyst under SEBI (Research Analysts) Regulations, 2014. Registration granted by SEBI, and certification from NISM in no way guarantee the performance of the Research Analyst or provide any assurance of returns to investors. Any questions should be directed to him at punit.jain@jainmatrix.com

Have you achieved Escape Velocity on your wealth?

In this note, Research Analyst Punit Jain shares his thoughts around Financial Freedom, a case study on Financial Goal based investing, and finally the concept of Escape Velocity on wealth.

Financial Freedom We used to call it Retirement, but now it is referred to as Financial Freedom. During our working careers we need to track our wealth, and have Financial Freedom as the Goal.

Its possible that Financial Freedom can be achieved before 60. And it need not be imposed on you by your employer, but achieved by you based on your earnings, lifestyle, planning and wealth management. Here are more details.

Case for Financial Goals: Being a primarily Equity focused professional, I have come up with a Case for Goals based investing. Its targeted at young working executives early in their career. Here it is –

This case has many assumptions, including ones stated above, and 1) This is for an equity investor starting off his journey 2) this is a primarily direct equity investment that can possibly give a 20% compounded return over the long term 3) By no means is 20% return a guarantee or even a promise, but just an achievable possibility, and real annual results can vary widely depending on the markets and the actual investments made by the investor. Also this case can be customized for different goals.

Escape Velocity in the context of space is the speed at which a rocket has to travel away from earth in order to escape its gravity force and enter space. For those so interested, it is 11.2 km per sec (6.96 miles).

Escape Velocity in the context of Financial Freedom is where your wealth and investments are large enough that the average annual gains from them exceed your average annual expenses. For this its required that your wealth grows faster than your expenses. To achieve this, most people need both good investments and good discipline.

A very simplified example. Lets say you have achieved a wealth corpus in equity of 30 lakhs. It is growing by 20% average a year, so this year by 6 lakhs. Your expenses however are 40,000 a month, or 4.8 lakhs a year. If your returns and expenses remain in this range, and you stay invested, you should be able to grow your corpus every year. You have already achieved Financial Escape Velocity !!

Direct Equity investments can help you achieve this Escape Velocity earlier, and better.

If you are an individual investor, we at JainMatrix Investments, as a SEBI registered Research Analyst firm can help with your wealth building. Sign up for our services, or to find out more reach out to us.

Do keep in mind that equity is a volatile asset class, and returns can vary widely from year to year.

Pricing and Payment Options

Also see our recently updated

Track Record

Regards, Punit Jain

Comment, leave a reply below, and like and share this post with your friends.

DISCLAIMER

This document has been prepared by JainMatrix Investments Bangalore (JM), and is meant for use by the recipient only as information and is not for circulation. This document is not to be reported or copied or made available to others without prior permission of JM. It should not be considered or taken as an offer to sell or a solicitation to buy or sell any security. The information contained in this report has been obtained from sources that are considered to be reliable. However, JM has not independently verified the accuracy or completeness of the same. This is a blog and marketing collateral. The securities quoted here, if any, are for illustration only and are not recommendatory. Neither JM nor any of its affiliates, its directors or its employees accepts any responsibility of whatsoever nature for the information, statements and opinion given, made available or expressed herein or for any omission therein. Recipients of this report should be aware that past performance is not necessarily a guide to future performance and value of investments can go down as well. The suitability or otherwise of any investments will depend upon the recipient’s particular circumstances and, in case of doubt, advice should be sought from an Investment Advisor. Investment in securities market are subject to market risks. Read all the related documents carefully before investing. Punit Jain is a registered Research Analyst under SEBI (Research Analysts) Regulations, 2014. Registration granted by SEBI, and certification from NISM in no way guarantee performance of the RA or provide any assurance of returns to investors. JM has been publishing equity research reports since Nov 2012. Any questions should be directed to the director of JainMatrix Investments at punit.jain@jainmatrix.com. Name of the RA as registered with SEBI – Punit Jain, SEBI Registration No. INH200002747.