BHEL – a Power Value Play

———————————————————————————————-

  • Date 7-Aug-13
  • CMP: Rs 116
  • Large Cap – Mkt Cap 28,300 crores
  • Advice: Buy with a 2-3 year perspective

Here is a short note on BHEL (Bharat Heavy Electricals Ltd)

JainMatrix Investments

Introduction

  • BHEL is an integrated power plant equipment manufacturing and implementation firm.
  • Its turnover in FY2013 was 48,000 crores, with profits at 6,600 cr. It has achieved Maharatna PSU status in 2013, which allows it greater operational freedom. Market Capitalization today is 28,300 cr, at CMP 116.
  • The manufacturing capacity is now 20,000 MW per annum, highest among all power-equipment vendors in India. It has a 59% share in Indian installed generating capacity contributing 69% to the total power generated.
  • Orders booked backlog is 1,10,000 cr, which is 2.3 times current revenue. This should tide it through the current slowdown. Core business is slow today but the manufacturing and execution strengths are immense.
  • Business is from sectors like Power Generation and Transmission, Railways, Renewable Energy, Oil & Gas and Defense. International projects are also increasing, diversifying business.
  • The divestment of BHEL has been postponed due to low valuations. It is still 67% owned by government, so this process is not urgent from a SEBI regulations point of view.
BHEL Price, JainMatrix Investments

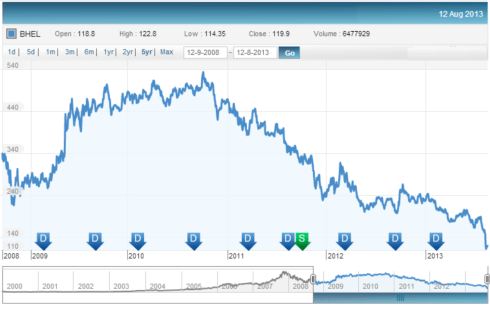
Fig 1: BHEL Price, JainMatrix Investments


Power Sector

  • In India, the overall power demand is growing at 8-10%. However, the domestic power sector looks weak right now due to poor fuel linkages, slow execution of projects, high debt and drying up of investment funding.
  • The govt is reviving the sector by:
    • Breaking State Electricity boards into independent distribution, generation and transmission firms.
    • Allowing raising of power tariffs, which the States have started to do. This is an economic necessity but a politically challenging task.
    • Pushing Coal India to meet production targets and sign fuel supply agreements with power producers.

Technical Factors

  • The Share price of BHEL has fallen 57% in last 1 year, and by 23% since the 3rd Aug Q1FY14 results.
  • A look at the price/volume shows that that this sharp sell-off seems to be done with, and the share should reverse rapidly from here.

Valuations

BHEL Financials, JainMatrix Investments

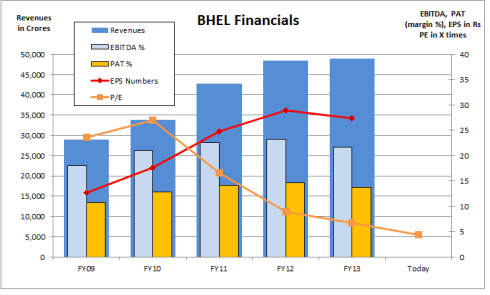
Fig2: BHEL Financials, JainMatrix Investments

  • Current P/E is 4.6 times, very cheap. Price/ Book is 1.12
  • Debt is almost zero, and cash on hand is 6600 cr (2012, the annual report of 2013 is not yet available).
  • Cash flow was only a small negative in 2012.
  • Dividend Yield is 5.5% today, comparable to post tax returns from FDs.
  • This fall is an over-reaction, and BHEL is available at 2005 price levels.

Overall Opinion

  • Based on all this, BHEL is a good contrarian call, value buy.
  • Buy with a 2-3 year perspective.

Do you agree? Whats your opinion? Share it. Visit, like and follow us with  JainMatrix on Facebook and  JainMatrix on LinkedIn 

JainMatrix Knowledge Base

See other useful reports

  • NHPC – Steady, Cheap, Defensive Power Generator – LINK 
  • Cairn India – A Formula for Success – LINK
  • Mindtree – A Possible Star – LINK
  • JainMatrix Mid Cap Model Portfolio 2013 – LINK
  • Apple Inc. – LINK
  • Arshiya International: A Collapsing Star – LINK
  • Bharti Airtel – This is a year of consolidation – LINK

Disclaimer:

These reports and documents have been prepared by JainMatrix Investments Ltd. They are not to be copied, reused or made available to others without prior permission of JainMatrix Investments. Any questions should be directed to the director of JainMatrix Investments at punit.jain@jainmatrix.com

Also see: https://jainmatrix.wordpress.com/disclaimer/

NHPC – Steady, Cheap, Defensive Power Generator

———————————————————————————————-

  • 16 July 2013
  • CMP: Rs 18.3
  • Large Cap – Mkt Cap 22,510 crores
  • Advice:  Buy

Here is a short note on NHPC Ltd. (National Hydro Power Corp).

JainMatrix Investments, NHPC report

Introduction 

  • NHPC is a listed PSU, a Mini-Ratna Category-I Enterprise. It is the major player in public sector hydro power in India.
  • It has 5,700MW of installed hydro power capacity, with projects of an additional 4,100MW coming on stream in the next 4 years.
  • FY13 consolidated revenues were 6400 crores and profits 2900 cr.
  • In terms of demand, there are few doubts. India is energy hungry, and NHPC produces low cost power that will always be in demand. The States are also now raising their electricity prices for consumers, so there is hope that India’s power sector will see better days going forward.
  • NHPC operates in difficult terrain, and its projects need multiple approvals and involve social disruptions. Thus capacity addition is a slow, difficult task. However once commissioned, projects produce low cost uninterrupted power for years. NHPC is also a trustworthy player in this sector.

Pricing and Valuation

  • NHPC has been a ‘steadily weakening’ stock over the last 4 years. The Share Price has been falling from the 2009 IPO price of 36 (peak 40) to today’s 18.3, a 16% per year fall over 4 years.
  • In terms of business performance however, the last 4 years have seen steady annual growth in the generation of electricity (3.2%) and in revenues and profits (both 16.5%).
  • Thus NHPC is today available at low valuations – with the P/E at 9.6 and P/B at 0.85, relatively cheap.
  • Debt/Equity is at 0.67, so the low gearing also provides comfort.
  • Also the dividend yield is 3.83%, which is attractive.
  • Free Cash Flow is also improving, moving into positive numbers in FY12 (the FY13 annual report is not yet available).

Near Term Factors

  • Seasonality: The firm produces most power in Q1 and Q2 of every year due to the summer and monsoon seasons. From a short term purchase point of view, this is a good time to buy, as next 2 quarter results should be very good with the record Indian monsoon (though some plants in Uttarkhand may not be working due to floods).
  • Stake Sale: Another event is the stake sale of NHPC which should happen in the next few weeks. The govt which owns 86.4% will divest 11.4% to reduce stake to SEBI ordered 75% levels.

Overall Opinion

  • In a nutshell, NHPC is a defensive, steady, long term PSU stock. Do not expect sharp out-performance. But the current share price is low, reducing down side risk. So this is a good time to buy NHPC.
  • If you decide to buy, watch the share over the next few days for the govt. stake sale, (it can fall in this period) and buy at current 18.3 or lower levels.

JainMatrix Knowledge Base

See other useful reports

  • Cairn India – A Formula for Success – LINK
  • Mindtree – A Possible Star – LINK
  • JainMatrix Mid Cap Model Portfolio 2013 – LINK
  • Apple Inc. – LINK
  • Arshiya International: A Collapsing Star – LINK
  • Bharti Airtel – This is a year of consolidation – LINK
  • Yes Bank – LINK

Disclaimer:

These reports and documents have been prepared by JainMatrix Investments Ltd. They are not to be copied, reused or made available to others without prior permission of JainMatrix Investments. Any questions should be directed to the director of JainMatrix Investments at punit.jain@jainmatrix.com

Also see: https://jainmatrix.wordpress.com/disclaimer/

Cairn India – A Formula for Success

  • 05 July 2013
  • CMP: Rs 294
  • Large Cap – Mkt Cap 56,100 crores
  • Advice:  Buy

Executive Summary

  • Formula for success: rise early, work hard, strike oil – (a quote by J. Paul Getty)
  • Cairn India is a large cap and the top Indian private sector Oil E&P firm.
  • It has excellent Oil exploration and producing assets. At current Revenue of 17,524 cr, Profits are 11,606 cr and the Cash Flow is 11,000 cr. The business is lucrative in terms of high cash flow, and low operating costs and investments, and debt free status.
  • For last 4 years, Operating and Profit margins are excellent at 69%, and 65% on average.
  • The demand outlook for oil in India is good, with 70% from imports, and annual growth at 6-8%. Cairn Profits get boosted with a weak rupee and increase in international oil prices.
  • The Valuations at a P/E of 4.6 times are very attractive making it a Value play.
  • Risks to this investment are: ability to sustain and grow oil production from current fields, make new discoveries from exploration assets, and ability to utilize or share the firm’s cash reserves

Business Snapshot:

  • Cairn India is the top Indian private sector Oil Exploration and Production firm.
  • The consolidated Revenue is 17,524 cr with Profits 11,606 cr (FY13) and cash balance of 16,713 cr.
  • Promoters are the UK listed Vedanta Resources/ Anil Agarwal group, that holds 58%. Vedanta Resources took over Cairn India Ltd (Cairn) from Cairn Energy UK in end 2011.
  • It’s a pioneering firm that has opened up the Indian Oil & Gas sector to private sector discoveries. From its first Oil discovery in Jan 2004, Cairn has come a long way to deliver on it’s potential and emerge as the second largest producer of Oil & Gas in India. Cairn’s oil production data are in Fig 1:
Fig 1 – Oil Production at Cairn, Source: Cairn corporate reports, JainMatrix Investments

Fig 1 – Oil Production at Cairn, Source: Cairn corporate reports

(kboepd – Kilo Barrels Of Oil Equivalent Per Day)

  • Current shareholdings are Promoters/Vedanta 58.8%, Cairn Energy UK 10.3%, MF/ DII/ FII 25.7%, Individuals 2.7% and Others 2.5%.
  • Cairn has about 1450 employees. It has the exploration assets portfolio in India (7), Sri Lanka (1) and South Africa (1). Commercial production is from Rajasthan, Cambay and Ravva fields in India.
  • In addition it owns the Mangala Processing Terminal, the Mangala development pipeline – a 590 km heated insulated pipeline for crude evacuation, and oil infrastructure at Ravva and Cambay.
  • The current 205 kboepd oil production includes 175 kboepd from Rajasthan. There is significant upside potential here, with the internal target as 215 kboepd by Mar2014. (Of 95% oil and 5% gas).
  • In the longer term there is (the asset evaluations show that the total resource base now provides) a basin potential to produce 300 kboepd, subject to further investments and regulatory approvals.
Fig 2 – Cairn Profit and Cost Metrics, JainMatrix Investments

Fig 2 – Cairn Profit and Cost Metrics, JainMatrix Investments

  • Cairn is among the lowest cost producers of Oil, and has among the highest net profit per barrel oil.

Business Model:

  • Cairn is paid for oil delivered to refineries. The Cairn business model is sensitive to the international oil prices, with the Rajasthan oil output priced at a 8-13% discount to Brent, in USD.
  • The rupee weakening against USD is also beneficial to Cairn, as it earns higher INR for the oil.
  • The recent decision to double natural gas prices to $8.4 per mBtu will also be beneficial to Cairn.

Pricing Snapshot 

Fig 3 Price History, JainMatrix Investments

Fig 3 Price History, JainMatrix Investments

The available 6-year view of the share price of Cairn Fig 3 shows us:

  • The IPO of Cairn was in Dec 2006; it was subscribed 1.14 times and got a listing price of Rs 160.
  • Since then, Cairn has given investors 10.5% returns CAGR to date.
  • Given its pioneering status, Cairn has seen a high level of interest. The pricing low was 88 in 2008, and the high 401 in Mar 2012, post the Vedanta takeover. Its fallen by 27% since then.

Financial Snapshot

Fig 4 – Consolidated Financials Snapshot, JainMatrix Investments

Fig 4 – Consolidated Financials Snapshot, JainMatrix Investments

  • Significant Oil revenues at Cairn actually only began in FY10. It has ramped up in the last 3 years, with the resolution of issues with State Governments, ONGC and Petroleum Ministry.
  • In line with this, the P/E (ttm) has rapidly fallen from 53 times (FY10) to 4.6 times currently. Fig 4.
  • At current levels of Revenue 17,524 cr, Cash Flow is 11,000 cr. The business is very lucrative in terms of cash flow, with low operating costs and investments. Current cash on the books at 16,713 cr is at Rs 87 per share. The firm is debt free.
  • For last 4 years, Operating and Profit margins are excellent at 69%, and 65% on average.
  • Dividend declared for FY13 is 115% or Rs 11.5 per share, giving a current dividend yield of 4%.
  • PEG based on 1 year projection is at 0.2 – indicates very undervalued stock.

Opportunities and Concerns

Strengths and Opportunities

  • India is oil deficit, and imports 70% of its oil, priced in US dollars. This has caused stress in India’s Current Account Deficit CAD. In these circumstances, Cairn is a very valuable firm, as it helps save import costs. It has had very good success rates at oil exploration.
  • The Rajasthan oil fields are expected to have a 23% growth in 1 year, and up to 71% in the next 3-4 years. In addition, the other Indian, Sri Lankan and South African oil fields have potential.
  • The Mangala development pipeline is being extended by 80 km up to a sea terminal at Bhogat in Gujarat. This will allow Cairn to sell to any of the coastal refiners for better margins.
  • The Promoter is Vedanta Resources plc is a diversified natural resources group with US$ 11 billion revenues. This provides stability and strength to business operations.
  • In India, Oil & Gas exploration, discovery and production has had a very poor record. ONGC has a poor record, and the private sector so far has not had a very free hand in terms of opportunities and incentives. In this scenario, if Cairn is able to expand its operations and continue on the current path, it can taste great success.
  • The major concern is how to use the large cash balance well. The firm has announced a USD 3 billion (Rs 16,500 crore) investment plan for the next 3 years to drill more than 450 wells in Rajasthan block, (increased from 25 wells drilled in FY2013). The wells planned include 100 exploration and appraisal wells, while balance will be development wells to sustain / enhance production volumes.

Risks and Concerns

  • Oil exploration and production is an inherently risky and unpredictable business. The BP /Gulf of Mexico oil spill of 2010 shows that disaster can strike suddenly, causing business losses.
  • Risk is also high in terms of the oil discovery to production cycle, which can take years of evaluation and studies. Oil Reserves can be ‘Proved’, ‘Probable’ and ‘Possible’.
  • Unpredictable govt. regulations and unclear subsidy/ revenue sharing with govt. can be a risk with this firm.
  • It has to be seen if Vedanta can continue on the pioneering path established by Cairn UK of successful exploration to oil production. A different skill set is needed at this stage for Cairn to negotiate effectively with government agencies, establish production infrastructure and compete effectively with rivals like Reliance.
  • New Promoter: Today Cairn is a high revenue, profitable, ‘Cash Cow’ type of firm. We need to see if the new Promoters respect the firm’s independence, reward shareholders for business performance and continue on the path of good corporate governance.

Opinion, Outlook and Recommendation

  • Oil consumption in India is in a very steady growth path, of 6-8% for the foreseeable future. The demand flows from transportation – vehicles, railways, airlines, shipping, and oil as fuel for factories, gensets, motors, tractors and infrastructure/ equipments/ agriculture.
  • With significant oil production, visible growth potential, many new discoveries moving into production, as well as production and exploration agreements in place with the regulator, Cairn is a valuable, cash rich oil stock.
  • At 4.6 times, the current P/E of Cairn puts it at a significant discount to most other Oil and Gas sector firms in India. It is a underpriced Value Stock. Valuations are attractive at these levels.
  • The maiden dividend awarded this year is 115%. With cash flow and profitability high, and production likely to grow, investors can expect to gain in terms of shareholder rewards.
  • Investors can buy Cairn at these price levels.

JainMatrix Knowledge Base

See other useful reports

  • Mindtree – A Possible Star – LINK
  • JainMatrix Mid Cap Model Portfolio 2013 – LINK
  • Apple Inc. – LINK
  • Arshiya International: A Collapsing Star – LINK
  • Bharti Airtel – This is a year of consolidation – LINK
  • Yes Bank – LINK

Disclaimer:

These reports and documents have been prepared by JainMatrix Investments Ltd. They are not to be copied, reused or made available to others without prior permission of JainMatrix Investments. Any questions should be directed to the director of JainMatrix Investments at punit.jain@jainmatrix.com

Also see: https://jainmatrix.wordpress.com/disclaimer/

Mindtree Ltd. – A Possible Star

_____________________________________________________________

  • 12 June 2013
  • CMP: Rs 800
  • Mid Cap – Mkt Cap 3550 crores.
  • Advice:  Buy

Executive Summary

Mindtree Ltd is a mid-sized IT services company based out of Bangalore. It has good management, experienced professionals drawn from the industry. The growth of the firm has been steady. Revenues, EBITDA and PAT have gained by 26%, 27% and 25% CAGR over the last 6 years. Mindtree has reached a certain critical size in terms of revenue and employees, from which growth can accelerate and it can be a large cap in 4-6 years. We expect these plans to play out and make it a very rewarding investment. 

(Find below a limited public report. Subscribers have access to the full report including Risks, Price – PE and EPS charts, Financial Projections, Benchmarking and 2 year Price Targets)

Mindtree Ltd. (MT) is a new age Mid Cap software services firm based in Bangalore.

Business Snapshot:

  • The consolidated turnover is Rs 2,362 crores and Profits 339 cr (FY13).
  • The Chairman is Subroto Bagchi and MD-CEO is Krishnakumar Natarajan; they co-founded the firm in 1999. Today it has about 11,600 employees, spread over Bangalore, Chennai, Hyderabad and Pune.
  • MT has a focus on 4 business verticals; USA is the largest revenue market, see Fig 1 A and B.
  • A recent achievement was the UID/Aadhaar project where MT developed the core application.
Fig 1 – Mindtree by Segments (A) and Geographies (B) for FY2013 (JainMatrix Investments)

Fig 1 – Mindtree by Segments (A) and Geographies (B) – JainMatrix Investments

Pricing Snapshot

The view of the share price of MT in 6 years since the 2007 IPO shows us:

  • From the IPO at Rs 425, the share price has risen by an annual average of 11.5% in 6 years.
  • The share has been volatile, as post IPO the peak was 1021, and the bottom 187 in 2009.
  • The Dividend has risen to the current 120%, see Fig 2, indicating a dividend yield of 1.5%.
Fig 2 – Price and Dividend History (JainMatrix Investments)

Fig 2 – Price and Dividend History (JainMatrix Investments)

Financial Snapshot

  • The Revenues, EBITDA and PAT have gained by 26%, 27% and 25% CAGR over 6 years.
  • MT is virtually debt free and has Cash on its books of 603 cr. or Rs 145/ share.
  • The average PE over the last 6 years is at 20 times. The P/E has moved in a range of 9-35 times, and is currently at 10 times.
  • In the last 3 years, the P/E of MT has been in the 8-14 times range, even as the share price has increased 2.5 times, in line with EPS growth.
Fig 3 – Financials Snapshot (JainMatrix Investments)

Fig 3 – Financials Snapshot (JainMatrix Investments)

 Opportunities and Strategies

  • The worldwide end-user spending in IT Services was US$ 845 billion in 2011, while Indian turnover was $88b, indicating a 10.4% global market share. (Source: Gartner, NASSCOM). Thus there is ample opportunity to grow.
  • Also big opportunities lie in adjacent /related markets like Software Products and bundled Hardware-Software solutions.
  • The industry contributed to 7.1% of the Indian GDP.
  • India has a competitive advantage in IT services due to availability of skilled manpower, good telecom/ internet infrastructure, English language skills and a lower cost structure.
  • With the industry having taken off in India in the 90s, the Indian firms now have sufficient scale, maturity and focus to be in contention to win IT services business in many global markets.
  • The recent USD strengthening (to around Rs 58) has improved the outlook for all IT exporters.
  • The IT Services industry has for long been linear in its growth, with addition of human resources contributing much of the business growth. But new business models are Non-linear, like SaaS, Outcome based contracts, platform based solutions, creation of IP, Products, etc.
  • MT’s identified business verticals of Product Engineering Services, Auto & Retail, BFSI and Travel, Media & Services are large sectors with good potential. Newer IT business trends like Mobility, Cloud and Open Source also seem to be well mapped. (Some important trends that we’d like to see MT into are Social Media and Big Data and Analytics).
  • MT is quite clear that growth will be organic and not through M&A. This is beneficial for investors.
  • With employee base > 10,000 and IT services turnover > 2000 crores, MT can be seen as a firm that has crossed a certain critical mass and now can bid for much larger new assignments.
  • MT is reducing its long tail of ‘small clients’ and focusing on mining its Fortune 500 clients to add service lines and grow business rapidly.

Opinion, Outlook and Recommendation

  • Over the next 2-3 years, exports growth is going to become very important in the Indian economy. The Software sector which is the leading exporter (25% of Indian exports in FY13) will receive a number of sops and benefits. In addition the USD strengthening will also boost sector performance.
  • MT is at a critical phase of growth, where it should be able to accelerate revenues and profits from this point, having achieved a certain critical mass.
  • MT has cash on its books of Rs 145 per share. In other words, a share of Rs 800 actually costs you only Rs 655. This is not an empty hope or wish. The savvy management has increased the Dividend this year from 40% to 120% to distribute this cash. Further shareholder enriching events can be expected in the medium term such as increase in dividends, bonus shares, share buyback, etc.
  • MT has gone through a cycle of very high expectations (and valuations) at the time of IPO, to a current state of low expectations. However it retains its essence of a savvy experienced management, global presence, absorption of new technologies and willingness to take small risks.
  • MT is a Buy at current levels.

JainMatrix Knowledge Base

See other useful reports

  • Tribhovandas Bhimji Zaveri – LINK 
  • JainMatrix Mid Cap Model Portfolio 2013 – LINK
  • Apple Inc. – LINK
  • Arshiya International: A Collapsing Star – LINK
  • Bharti Airtel – This is a year of consolidation – LINK
  • Yes Bank – LINK

Do you find this site useful?

  • Visit the SUBSCRIBE page to find how you can get more. Click LINK
  • Register Now to get our Free reports and much more, on the top right of this page, or by filling this Signup Form CLICK.

Disclaimer:

These reports and documents have been prepared by JainMatrix Investments Ltd. They are not to be copied, reused or made available to others without prior permission of JainMatrix Investments. Any questions should be directed to the director of JainMatrix Investments at punit.jain@jainmatrix.com

Also see: https://jainmatrix.wordpress.com/disclaimer/

JainMatrix Mid Cap Model Portfolio Update March 2013

……

JainMatrix Investments presented the Mid Cap Model Portfolio in Feb 2013. Its time to review the portfolio, understand the changes in this period, and continue with our planned investments wherever appropriate.

The seven (7) stocks recommended are tracked with updates on the following basis:

  • Q3FY13 updates
  • FY13 Budget effect
  • Any sharp price movements
  • Overall fundamentals

We are glad to note that this portfolio has outperformed the Indices in this short period.

To read this valuable report, you need to subscribe to JainMatrix Investments. Visit  Subscribe

On this link, check the details and Subscribe to this website to receive valuable reports directly delivered to your Inbox.

JainMatrix Knowledge Base

See other useful reports

  • JainMatrix Mid Cap Model Portfolio 2013 – LINK
  • KEC International – LINK
  • Mahindra Holidays – LINK 
  • Apple Inc. – LINK
  • CARE IPO – LINK 
  • Arshiya International: A Collapsing Star – LINK
  • Bharti Airtel – This is a year of consolidation – LINK
  • Yes Bank – LINK
  • L&T: At the Business Crossroads – LINK

Do you find this site useful?

  • Visit the SUBSCRIBE page to find how you can get more. Click LINK
  • Register Now to get our Free reports and much more, on the top right of this page, or by filling this Signup Form CLICK.

Disclaimer:

These reports and documents have been prepared by JainMatrix Investments Ltd. They are not to be copied, reused or made available to others without prior permission of JainMatrix Investments. Any questions should be directed to the director of JainMatrix Investments at punit.jain@jainmatrix.com

Also see: https://jainmatrix.wordpress.com/disclaimer/

………………………………………………………………………………………………………


Mahindra Holidays: Take this break !!

————————————————————————————————————————————

  • Mar 7, 2013
  • CMP: Rs 276
  • Mid Cap – Market Cap 2334 crores
  • Advice: BUY

JainMatrix Investments presents investors the complete report on Mahindra Holidays published earlier for subscribers only.

Here is a note on Mahindra Holidays.

Summary:

  • Mahindra Holidays is an Indian leader in Vacation Ownership/ Timeshare. It has an excellent brand and is part of a prestigious group. In its business segment, it is a revenue and market share leader.
  • It has added significant capacities in the past years, in India and abroad. The next few quarters should see MH being able to monetize these assets.
  • The 52% fall in share price in the last 3 years should thus be seen as an opportunity to BUY the share at a lower price, and better entry valuations.  

Business Snapshot:

Mahindra Holidays is a leader in Indian Leisure Timeshare

  • Mahindra Holidays and Resorts (MH) is a Travel & Tourism firm and a leader in Vacation Ownership.
  • MH had Revenues of 637 crores and Profits 105 cr in FY12.
  • The MD & CEO is Rajiv Sawhney. MH is part of the USD 16 billion Mahindra group.
  • MH has over 1,55,000 members (customers), and 40 resorts with 2,200 rooms. There has been an aggressive increase in room inventory in the past few years. (Fig 1). The resorts growth strategy too is mapped in Fig 1.
  • Started in 1996, the company’s flagship brand is ‘Club Mahindra Holidays’.  Other brands in the portfolio are Zest Breaks, Club Mahindra Fundays and Mahindra Travels.
Fig 1 – Resorts and Members, JainMatrix Investments

Fig 1 – Resorts and Members, JainMatrix Investments

  •  Revenues are from Members, who 1) buy the timeshare/ initial payment 2) annual subscription charge 3) Spend on services during the stay 4) unused rooms sold to non-members (like any resort).
  • Promoter hold 83%, while rest is with Institutions 4.5%, Individuals 6% and Others 2.5%. This is a good sign. But the Promoters may need to divest their holding to 75% soon.

Pricing Snapshot

The available 4-year share price history of MH shows us:

  • The IPO was in June 2009, and pricing was Rs 300 . It got oversubscribed 9.8 times.
  • The share has been quite volatile, as from a post IPO price of 395 in July 2009, it rose to a peak of 574 in March 2010, then fell to a low of 255 in May 2012. See LINK 
  • Today at 275, it has given a negative return to IPO investors over 4 years.

Financial Snapshot

Fig 2 – Financials Snapshot , JainMatrix Investments

Fig 2 – Financials Snapshot, JainMatrix Investments

  •  Consolidated Revenues, EBITDA and PAT have gained by 14%, 4.2% and 6.7% CAGR over 5 years. While revenues are good, EBIDTA and PAT margins have fallen.
  • P/E has moved in a range of 23-41 times, indicating the perceived leadership position of MH.
  • The total debt of about Rs 1070 cr (FY12) does not look too high, when we see that the D/E is 2.0 on an overall basis. Dividend at 40% gives a dividend yield of 1.45%.
Fig 3 – Consolidated Cash Flows are positive, JainMatrix Investments

Fig 3 – Consolidated Cash Flows are positive, JainMatrix Investments

  • Further, the Free Cash Flow mapping can be seen in Fig 4. Except for FY10, the FCF is zero or positive. We can see that a number of new resorts and new rooms have been added at MH – Fig 1. In spite of this addition, MH has maintained positive FCF. This is a good sign of financial control.

News, Opportunities and Concerns

News

  • MH has added international locations like Austria, Bangkok, Pattaya and Kuala Lumpur. It has obtained a license to operate in the UAE and is looking to make this operational soon.
  • MH is proceeding with a stake sale under the offer for sale (OFS) route on 7th March 2013. It has fixed ‘floor price’ at Rs 270 per share for the sale of its 4.02% in the company, to fetch around Rs 92 cr. The company is offloading shares to comply with SEBI’s guidelines on minimum public shareholding. The OFS received a good response, and was subscribed 1.3 times.
  • 40% of bookings today are done through their Interactive Online portal, from zero 15 months ago.

Opportunities

  • Leisure travel in India is at an early stage of growth, and is a function of affluence and lifestyle.
  • As per MH data, the total VO membership is 3.5 lakh (giving MH a 44% membership marketshare). The target market is households with annual income> 17 lakhs, which numbers 30 lakhs. Thus there is ample opportunity, of over 8 times for this industry.
  • MH has an excellent brand of Club Mahindra, something that is well recognized and valuable. Plus the rub off of the Mahindra group.
  • 90% of the MH resorts have a rating of 4 or over out of 5 on TripAdvisor. This is an excellent rating.
  • MH is able to fund capex from membership fees and internal accruals. This is financially prudent.

Concerns and Threats 

  • The current economic slowdown can slow discretionary expenditure at consumer level.
  • Resort and rooms addition is a very capital intensive exercise, and something MH should not overstretch itself on.
  • Looking at the 5 star hotel industry in India, the annual demand growth for hotel rooms remaining subdued at around 7 per cent in 2012-13 and 2013-14. This will be compounded by large-scale room additions: CRISIL Research expects 14,500 rooms to be added in 2013-14 to the existing 46,200 rooms. This is a negative indicator for the demand for MH.

Opinion, Outlook and Recommendation

  • MH is emerging from a 2-3 year period of investments in room addition. In this period, it has managed to add to its number of members, and has a good inventory of rooms available for them.
  • All this has been done without overstretching the balance sheet, and with just a small blip on the financials.
  • The OFS activity will also make available additional funds to MH for corporate use.
  • The business outlook in the next few years for MH is positive.
  • The fall in share price of 52% from the peak in March ’10 to today should be seen as an opportunity to buy a strong business at a lower cost.

Do you find this site useful?

  • Visit the SUBSCRIBE page to find how you can get more. Click LINK
  • Register Now to get our Free reports and much more, on the top right of this page, or by filling this Signup Form CLICK.

JainMatrix Knowledge Base

See other useful reports

  • There’s nothing wrong with Apple Inc – LINK
  • Make Equity Investing less tricky: the JainMatrix Eleven – Link to Report
  • Yes Bank: The Brave Warrior of Indian Banks – Link to Report
  • Bharti Airtel: This is a year of consolidation – Link to Report
  • Arshiya International: A Collapsing Star – LINK
  • Adani Port – The Great Australian Adventure – Link to Report

Disclaimer:

This document has been prepared by JainMatrix Investments Bangalore (JM), and is meant for use by the recipient only as information and is not for circulation. This document is not to be reported or copied or made available to others without prior permission of JM. It should not be considered or taken as an offer to sell or a solicitation to buy or sell any security. The information contained in this report has been obtained from sources that are considered to be reliable. However, JM has not independently verified the accuracy or completeness of the same. Neither JM nor any of its affiliates, its directors or its employees accepts any responsibility of whatsoever nature for the information, statements and opinion given, made available or expressed herein or for any omission therein. Recipients of this report should be aware that past performance is not necessarily a guide to future performance and value of investments can go down as well. The suitability or otherwise of any investments will depend upon the recipient’s particular circumstances and, in case of doubt, advice should be sought from an independent Financial Expert/Advisor. Either JM or its affiliates or its directors or its employees or its representatives or its clients or their relatives may have position(s), make market, act as principal or engage in transactions of securities of companies referred to in this report and they may have used the research material prior to publication. Any questions should be directed to the director of JainMatrix Investments at punit.jain@jainmatrix.com

There’s nothing wrong with Apple Inc.

  • Feb 21st 2013 
  • CMP: $446
  • Global #1 Cap – Mkt Cap $ 421 billion. 
  • Advice:  Buy

Note our more recent Feb 2015 note on Apple

Apple Inc and the Happiest Moment 

This week, a subscriber asked me a simple sounding question … What do you think of Apple at this point?

Let me try to answer this ….

About Apple

This iconic American firm is an innovation powerhouse. It has created new products with so much originality, usability and technology finesse that it has created new markets for itself.

jainmatrix investments, apple

  • The Macintosh showed that Apple had the streak of innovation decades ago (launch in 1984).
  • Tens of manufacturers struggled with Tablets for years, with no success. Apple launched iPad, and showed them how (launch 2010).  Ditto a bit earlier for iPods (launch 2001).
  • In mobiles, the success is even more amazing. In a crowded market, with many success stories, and tens of fierce competitors, Apple launched iPhone (in 2007), a single model, with 2-3 variants, a premium pricing, and a limited network alliance (in the USA). And the top end of the market exploded.
  • Its iTunes that binds these products together beautifully with the application ecosystem, music, video and payment systems.
  • Steve Jobs, the Chairman and Founder of Apple Inc is a legend for his leadership and focus, which has pretty much taken Apple on this pioneering path. We lost him in 2011, and Tim Cook took over as CEO of Apple.
  • In Sept 2012, Apple Inc shares were $700, and market cap at $656 billion, making it by far the most valuable company in the world.

Cut to today

  • The Apple innovation machine continues relentlessly. The new iPhone 5 is better and selling well. The iPad mini expands the market with premium features at a lower price point.
  • See Apple financials in Fig 1 with revenue in USD m (LHS) and Margins in %, EPS in USD and P/E on RHS
Apple Financials, JainMatrix Investments

Fig 1 – Apple Financials, JainMatrix Investments (click to expand)

  • Revenues, EBITDA and EPS have grown at 54%, 68% and 72% CAGR respectively over the last 4 years.
  • Markets like India are summarily dismissed as ‘not big enough’ to warrant corporate attention :-)
  • However, the Apple share price is $449, down 36% in 5 months, and market cap is $421 billion.
  • The cash and cash equivalents on hand at Apple is $137 billion (about $146 per share). Last year profits were $42 billion.
  • PE of Apple is at a 5 year low, of about 10 times, see Fig 2.
Apple PE, JainMatrix Investments

Fig 2: Apple PE, JainMatrix Investments (click to expand)

So, what’s gone wrong?

  • Apple it seemed did not know what to do with its massive profits. And profits, unless shared with shareholders, or used in good capital investments, earn very little in a bank account.
  • Things are now changing a bit …. Shareholders started receiving a quarterly dividend of $2.65 a share from July 1, 2012. Share buybacks  began in the fiscal year starting Sept. 30 2012 and happen over three years. So now, Apple plans to return $45 billion to its shareholders through dividends and stock repurchases over the next three years.

And what’s the outlook for Apple at this point?

  • Excited by consumer euphoria, massive profits and a seemingly unstoppable share price rise, the investor is now rattled by the big fall and uncertainty.
  • Looks like the recent announcements have not sunk into the investor psyche yet.
  • At a PE of 10 times, the valuation is at a 5 year low. With revenues and profits growing by 54% and 72% a year, the outlook is rosy. The forward dividend yield is 2.3%.
  • With these new announcements, and the Apple management working in the right direction, Apple today is a buy.

 JainMatrix Knowledge Base:

See other useful reports

Disclosure: It is safe to assume that if the JainMatrix website recommends a stock, the researcher has already invested in it, if he can (Apple isn’t listed in India) .

Do you find this site useful?

  • Visit the SUBSCRIBE page to find how you can get more. Click LINK
  • Register Now to get our Free reports and much more, on the top right of this page, or by filling this Signup Form CLICK.

Disclaimer:

These reports and documents have been prepared by JainMatrix Investments Ltd. They are not to be copied, reused or made available to others without prior permission of JainMatrix Investments. Any questions should be directed to the director of JainMatrix Investments at punit.jain@jainmatrix.com

Also see: https://jainmatrix.wordpress.com/disclaimer/