Visit and like our insta handle to get updates https://www.instagram.com/jainmatrix_investments/
It’s as good a time as any to be a positive investor.
Discover Investment Services from JainMatrix – PRICING AND PAYMENT OPTIONS

Visit and like our insta handle to get updates https://www.instagram.com/jainmatrix_investments/
It’s as good a time as any to be a positive investor.
Discover Investment Services from JainMatrix – PRICING AND PAYMENT OPTIONS
25th June 2024
We want you to think positive, and read just a few good articles, so here goes:
Regards,
Punit Jain
This document has been prepared by JainMatrix Investments Bangalore (JM), and is meant for use by the recipient only as information and is not for circulation. This document is not to be reported or copied or made available to others without prior permission of JM. It should not be considered or taken as an offer to sell or a solicitation to buy or sell any security. The information contained in this report has been obtained from sources that are considered to be reliable. However, JM has not independently verified the accuracy or completeness of the same. Punit Jain and JM has no ownership or known financial interests in any company mentioned in this note. Neither JM nor any of its affiliates, its directors or its employees accepts any responsibility of whatsoever nature for the information, statements and opinion given, made available or expressed herein or for any omission therein. Recipients of this report should be aware that past performance is not necessarily a guide to future performance and value of investments can go down as well. The suitability or otherwise of any investments will depend upon the recipient’s particular circumstances and, in case of doubt, advice should be sought from an Investment Advisor. Punit Jain is a registered Research Analyst under SEBI (Research Analysts) Regulations, 2014. JM has been publishing equity research reports since Nov 2012. Any questions should be directed to the director of JainMatrix Investments at punit.jain@jainmatrix.com.

Here is a note on Aadhar Housing Finance IPO – AHF.

Fig 1.1 – AUM by States / Fig 1.2 – Key leaders
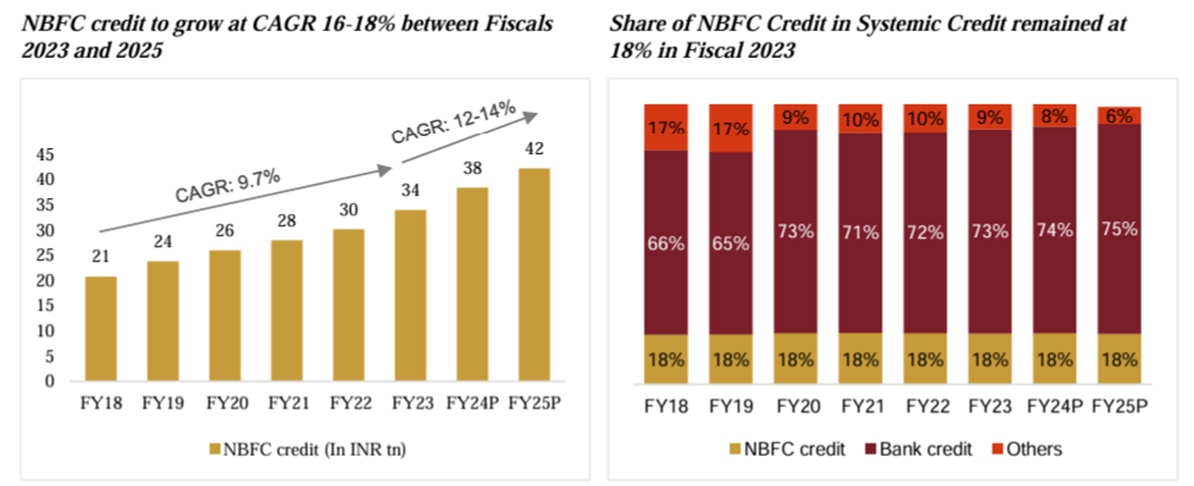
Fig 2.1 NBFC Industry
Loan services offered are-
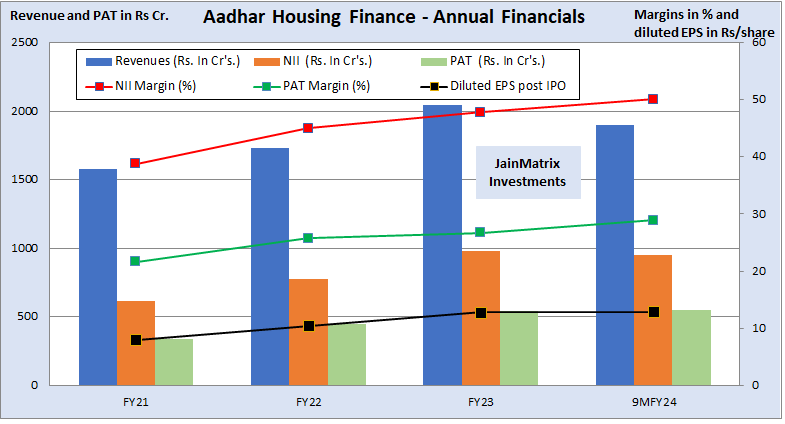
Fig 3.1 – Financials
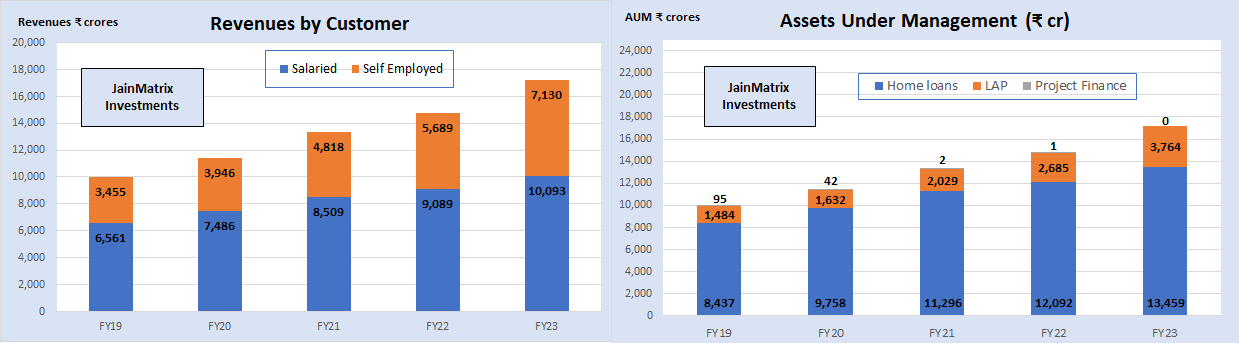
Fig 3.2 – Product-wise Revenue, Fig 3.3 Assets under Management

Fig. 3.4 – Shareholding pattern pre and post IPO

Fig 4.1 – Benchmarking
In a benchmarking exercise we compare AHF to industry peers, to understand it better. See Fig 4.1.
AHF hasn’t stood out as either very good or bad on the benchmarking section. It appears to be stable and improving steadily on current performance. The high valuations can be interpreted as the cost of quality.

Fig 4.2 – SWOT
Punit Jain discloses that he has no positions in Aadhar Housing Finance or Blackrock Asset as on date of this report. But inline with this report, he intends to subscribe to the Aadhar Housing Finance in the IPO.
This document has been prepared by JainMatrix Investments Bangalore (JMI), and is meant for use by the recipient only as information and is not for circulation. This document is not to be reported or copied or made available to others without prior permission of JMI. It should not be considered or taken as an offer to sell or a solicitation to buy or sell any security. The information contained in this report has been obtained from sources that are considered to be reliable. However, JMI has not independently verified the accuracy or completeness of the same. Neither JMI nor any of its affiliates, its directors or its employees accepts any responsibility of whatsoever nature for the information, statements and opinion given, made available or expressed herein or for any omission therein. Recipients of this report should be aware that past performance is not necessarily a guide to future performance and value of investments can go down as well. The suitability or otherwise of any investments will depend upon the recipient’s particular circumstances and, in case of doubt, advice should be sought from a RIA Registered Investment Advisor. Investment in securities market are subject to market risks. Read all the related documents carefully before investing.
Punit Jain is a registered Research Analyst under SEBI (Research Analysts) Regulations, 2014. Registration granted by SEBI, and certification from NISM in no way guarantee performance of the RA or provide any assurance of returns to investors. JMI has been publishing equity research reports since Nov 2012. Any questions should be directed to the director of JainMatrix Investments at punit.jain@jainmatrix.com Name of the RA as registered with SEBI – Punit Jain, SEBI Registration No. INH200002747. Logo/brand name –
This report was published on 25nd Mar 2024, so all prices and news are dated accordingly. This is a research note on 3 leading Indian NBFC firms, Bajaj Finance, Jio Financial Services and L&T Finance Holdings. We profile the firms in terms of their structure, business segments, share price history and key financial parameters. Next we capture their key Qualitative Aspects and do a SWOT analysis of them, to help investors understand these firms better. This report is for educational purposes. We do not set any price targets nor make any company-specific recommendations.
In this note, we examine three large players from the Indian Non-Banking Financial (NBFC) Industry.

Brief Profiles – Bajaj Finance Ltd. CMP ₹ 6,760
Jio Financial Services CMP ₹ 345
L&T Finance Holdings CMP ₹ 155
This report can be downloaded as a PDF file using link below.
Disclaimer This document has been prepared by JainMatrix Investments Bangalore (JMI), and is meant for use by the recipient only as information and is not for circulation. This document is not to be reported or copied or made available to others without prior permission of JMI. It should not be considered or taken as an offer to sell or a solicitation to buy or sell any security. The information contained in this report has been obtained from sources that are considered to be reliable. However, JMI has not independently verified the accuracy or completeness of the same. Punit Jain discloses that he is an investor in Bajaj Finance Ltd (<1%) since April 2003. He has no positions in L&T Finance or Jio Financial Services, but owns shares in group companies Larsen & Toubro, L&T Technology Services and LTIM; and Reliance Industries (all <1%) as on date of this report. Neither JMI nor any of its affiliates, its directors or its employees accepts any responsibility of whatsoever nature for the information, statements and opinion given, made available or expressed herein or for any omission therein. Recipients of this report should be aware that past performance is not necessarily a guide to future performance and value of investments can go down as well. The suitability or otherwise of any investments will depend upon the recipient’s particular circumstances and, in case of doubt, advice should be sought from a RIA Registered Investment Advisor. Investment in securities market are subject to market risks. Read all the related documents carefully before investing. Punit Jain is a registered Research Analyst under SEBI (Research Analysts) Regulations, 2014. Registration granted by SEBI, and certification from NISM in no way guarantee performance of the RA or provide any assurance of returns to investors. JMI has been publishing equity research reports since Nov 2012. Any questions should be directed to the director of JainMatrix Investments at punit.jain@jainmatrix.com Name of the RA as registered with SEBI – Punit Jain, SEBI Registration No. INH200002747. Logo/brand name –
Did you know that the definition of a large-cap, mid-cap and small-cap in India changes every 6 months? This applies particularly for Indian Mutual Funds, so that as of now –

This is quite relevant for Mutual Funds, where many define their strategy as Large Caps or Small caps. This definition, and periodic reviews, ensures that MFs stick to their strategy.
For direct investors too, we can loosely follow this definition.
This also means that firms doing well by market cap may transition up from one group to another. Several firms may also transition down, given how sharply the limits have increased. This transition may mean that MFs may buy or exit from them, in order to retain their MF strategy.
JainMatrix Investments is a SEBI registered Research Analyst firm. We publish research recommendations grouped by 1) Large Cap, 2) Mid & Small Cap and 3) Satellite stocks, which is a mixed group. With these investors can invest directly in recommended equities for their Wealth building journey.
Source – Article – AMFI classification: Jio Financial makes it to largecap list, Tata Tech, IREDA midcaps https://www.moneycontrol.com/news/business/markets/amfi-classification-jio-financial-makes-it-to-largecap-list-tata-tech-ireda-midcaps-11996161.html
This document has been prepared by JainMatrix Investments Bangalore (JM), and is meant for use by the recipient only as information and is not for circulation. This document is not to be reported or copied or made available to others without prior permission of JM. It should not be considered or taken as an offer to sell or a solicitation to buy or sell any security. The information contained in this report has been obtained from sources that are considered to be reliable. However, JM has not independently verified the accuracy or completeness of the same. Neither JM nor any of its affiliates, its directors or its employees accepts any responsibility of whatsoever nature for the information, statements and opinion given, made available or expressed herein or for any omission therein. Recipients of this report should be aware that past performance is not necessarily a guide to future performance and value of investments can go down as well. The suitability or otherwise of any investments will depend upon the recipient’s particular circumstances and, in case of doubt, advice should be sought from a RIA Registered Investment Advisor. Investment in securities market are subject to market risks. Read all the related documents carefully before investing. Punit Jain is a registered Research Analyst under SEBI (Research Analysts) Regulations, 2014. Registration granted by SEBI, and certification from NISM in no way guarantee performance of the RA or provide any assurance of returns to investors. JM has been publishing equity research reports since Nov 2012. Any questions should be directed to the director of JainMatrix Investments at punit.jain@jainmatrix.com. Name of the RA as registered with SEBI – Punit Jain, SEBI Registration No. INH200002747. Logo/brand name –

Here is a note on RP Tech IPO.

Fig 1.1 – Revenues by Vertical and Fig 1.2 Market Shares

Fig 1.3 Locations
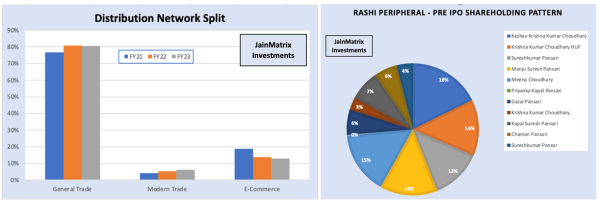
Fig 1.4 – Distribution and 1.5 – Shareholding pattern
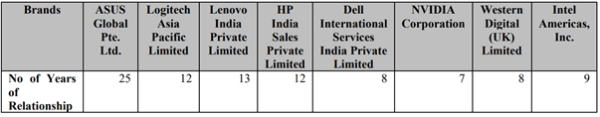
Fig 1.6 Clients

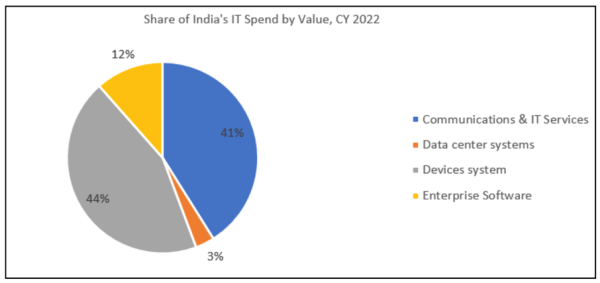
Fig 2 – ICT Industry Size

Fig 3a – Financials
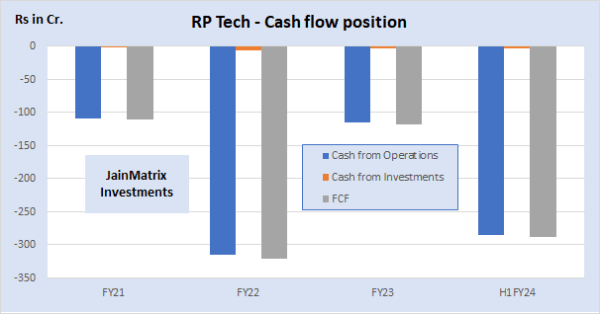
Fig 3b Cash Flow
We benchmark RP Tech against listed ICT distribution and mfg. firms, See Fig 3c below.

Fig 3c – Benchmarking
This document has been prepared by JainMatrix Investments Bangalore (JM), and is meant for use by the recipient only as information and is not for circulation. This document is not to be reported or copied or made available to others without prior permission of JM. It should not be considered or taken as an offer to sell or a solicitation to buy or sell any security. The information contained in this report has been obtained from sources that are considered to be reliable. However, JM has not independently verified the accuracy or completeness of the same. JM has no stake ownership or financial interests in RP tech or any group company. Punit Jain intends to apply for this IPO. Neither JM nor any of its affiliates, its directors or its employees accepts any responsibility of whatsoever nature for the information, statements and opinion given, made available or expressed herein or for any omission therein. Recipients of this report should be aware that past performance is not necessarily a guide to future performance and value of investments can go down as well. The suitability or otherwise of any investments will depend upon the recipient’s particular circumstances and, in case of doubt, advice should be sought from a RIA Registered Investment Advisor. Investment in securities market are subject to market risks. Read all the related documents carefully before investing. Punit Jain is a registered Research Analyst under SEBI (Research Analysts) Regulations, 2014. Registration granted by SEBI, and certification from NISM in no way guarantee performance of the RA or provide any assurance of returns to investors. JM has been publishing equity research reports since Nov 2012. Any questions should be directed to the director of JainMatrix Investments at punit.jain@jainmatrix.com. Name of the RA as registered with SEBI – Punit Jain, SEBI Registration No. INH200002747. Logo/brand name –
TCS is a well-known Large Cap stock. TCS has announced a Buyback offer, here is a note on this. The offer is attractive.
Punit Jain discloses that he is a long term investor (less than 1%) in TCS since 2012. Punit Jain was an employee of TCS from 1995 to 2001. He will also take part in this BUYBACK. Other than these, Punit Jain and JainMatrix Investments Bangalore (JMI) and its promoters/ employees have no direct or financial interest in TCS, and no known material conflict of interest as on date of publication of this report. This document has been prepared by JMI, and is meant for use by the recipient only as information and is not for circulation. This document is not to be reported or copied or made available to others without prior permission of JMI. It should not be considered or taken as an offer to sell or a solicitation to buy or sell any security. The information contained in this report has been obtained from sources that are considered to be reliable. However, JMI has not independently verified the accuracy or completeness of the same. Neither JMI nor any of its affiliates, its directors or its employees accepts any responsibility of whatsoever nature for the information, statements and opinion given, made available or expressed herein or for any omission therein. Recipients of this report should be aware that past performance is not necessarily a guide to future performance and value of investments can go down as well. The suitability or otherwise of any investments will depend upon the recipient’s particular circumstances and, in case of doubt, advice should be sought from a RIA Registered Investment Advisor. Investment in securities market are subject to market risks. Read all the related documents carefully before investing. Punit Jain is a registered Research Analyst under SEBI (Research Analysts) Regulations, 2014. Registration granted by SEBI, and certification from NISM in no way guarantee performance of the RA or provide any assurance of returns to investors. JMI has been publishing equity research reports since Nov 2012. Any questions should be directed to the director of JainMatrix Investments at punit.jain@jainmatrix.com. Name of the RA as registered with SEBI – Punit Jain, SEBI Registration No. INH200002747.
