
Category: IPO/FPO ANALYSIS
-
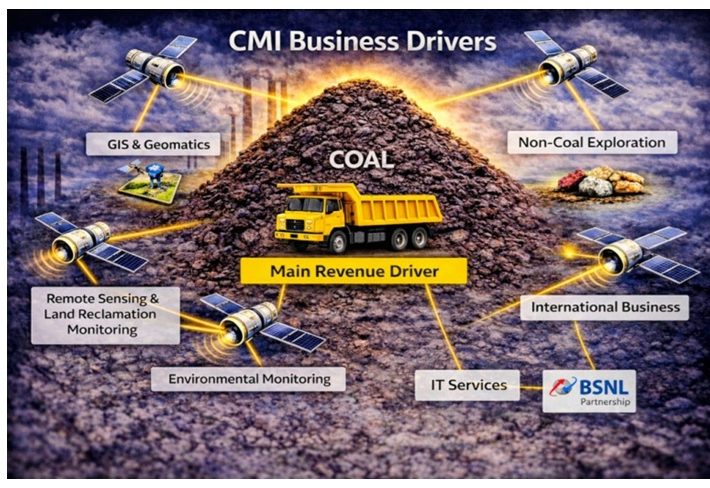
CMI IPO – Self Sufficiency in Fuels – Buy
IPO highlights Introduction News, Updates and Strategies Industry Overview Market Trends: Financial Performance and Stock Evaluation Overall, CMI’s financials reflects strong profitability, efficient capital utilization, and stable operations. SWOT Analysis Benchmarking CMI is compared with peers in engineering, consultancy, project & analytical services. See Fig 4b. Opinion, Outlook and Recommendation Disclaimers and Disclosures
-
Tata Capital IPO – Emerging Player
In this note, we look closely at Tata Capital Ltd (TCL) which is opening for its IPO this week. IPO Details Tata Capital Introduction Comparison of Financial Parameters We analyse the key ratios and financial data for TCL with 2 peers. See table and analyses below. Fig 1 Benchmarking Annual data is for…
-
Belrise Industries IPO – Strong as the Chassis
IPO highlights Summary Entire Report in PDF format: Disclaimers and Disclosures
-

Hyundai Motor India IPO – This Time It’s Different
Summary Why Hyundai India: As the #2 company in Indian passenger vehicles, Hyundai Motor India has been popular for its attractive cars. Combining good riding with fair prices, it’s products have held up well against Maruti’s value offerings and the Indian, European and Japanese automobile firms. Capacity utilization is close to 100%, so the new…
-

Bajaj Housing Finance IPO – Take This Loan
Summary: Here is a note on Bajaj Housing Finance Ltd – BHFL. IPO highlights Download Full Report Disclaimers and Disclosures
-
Ola Electric IPO – Profitability in 2 years
Summary Here is a note on Ola Electric Mobility Ltd (OLA). IPO highlights See report in PDF format Disclaimers and Disclosures
-

Aadhar Housing Finance IPO – Constructive
Here is a note on Aadhar Housing Finance IPO – AHF. IPO highlights Introduction Fig 1.1 – AUM by States / Fig 1.2 – Key leaders Industry Outlook of Indian Housing Sector Fig 2.1 NBFC Industry Aadhar Housing – Financials Loan services offered are- Fig 3.1 – Financials Fig 3.2 – Product-wise Revenue, Fig 3.3…
